Elrond Price Prediction: EGLD needs to close above multiple resistance barriers to trigger a 70% upswing
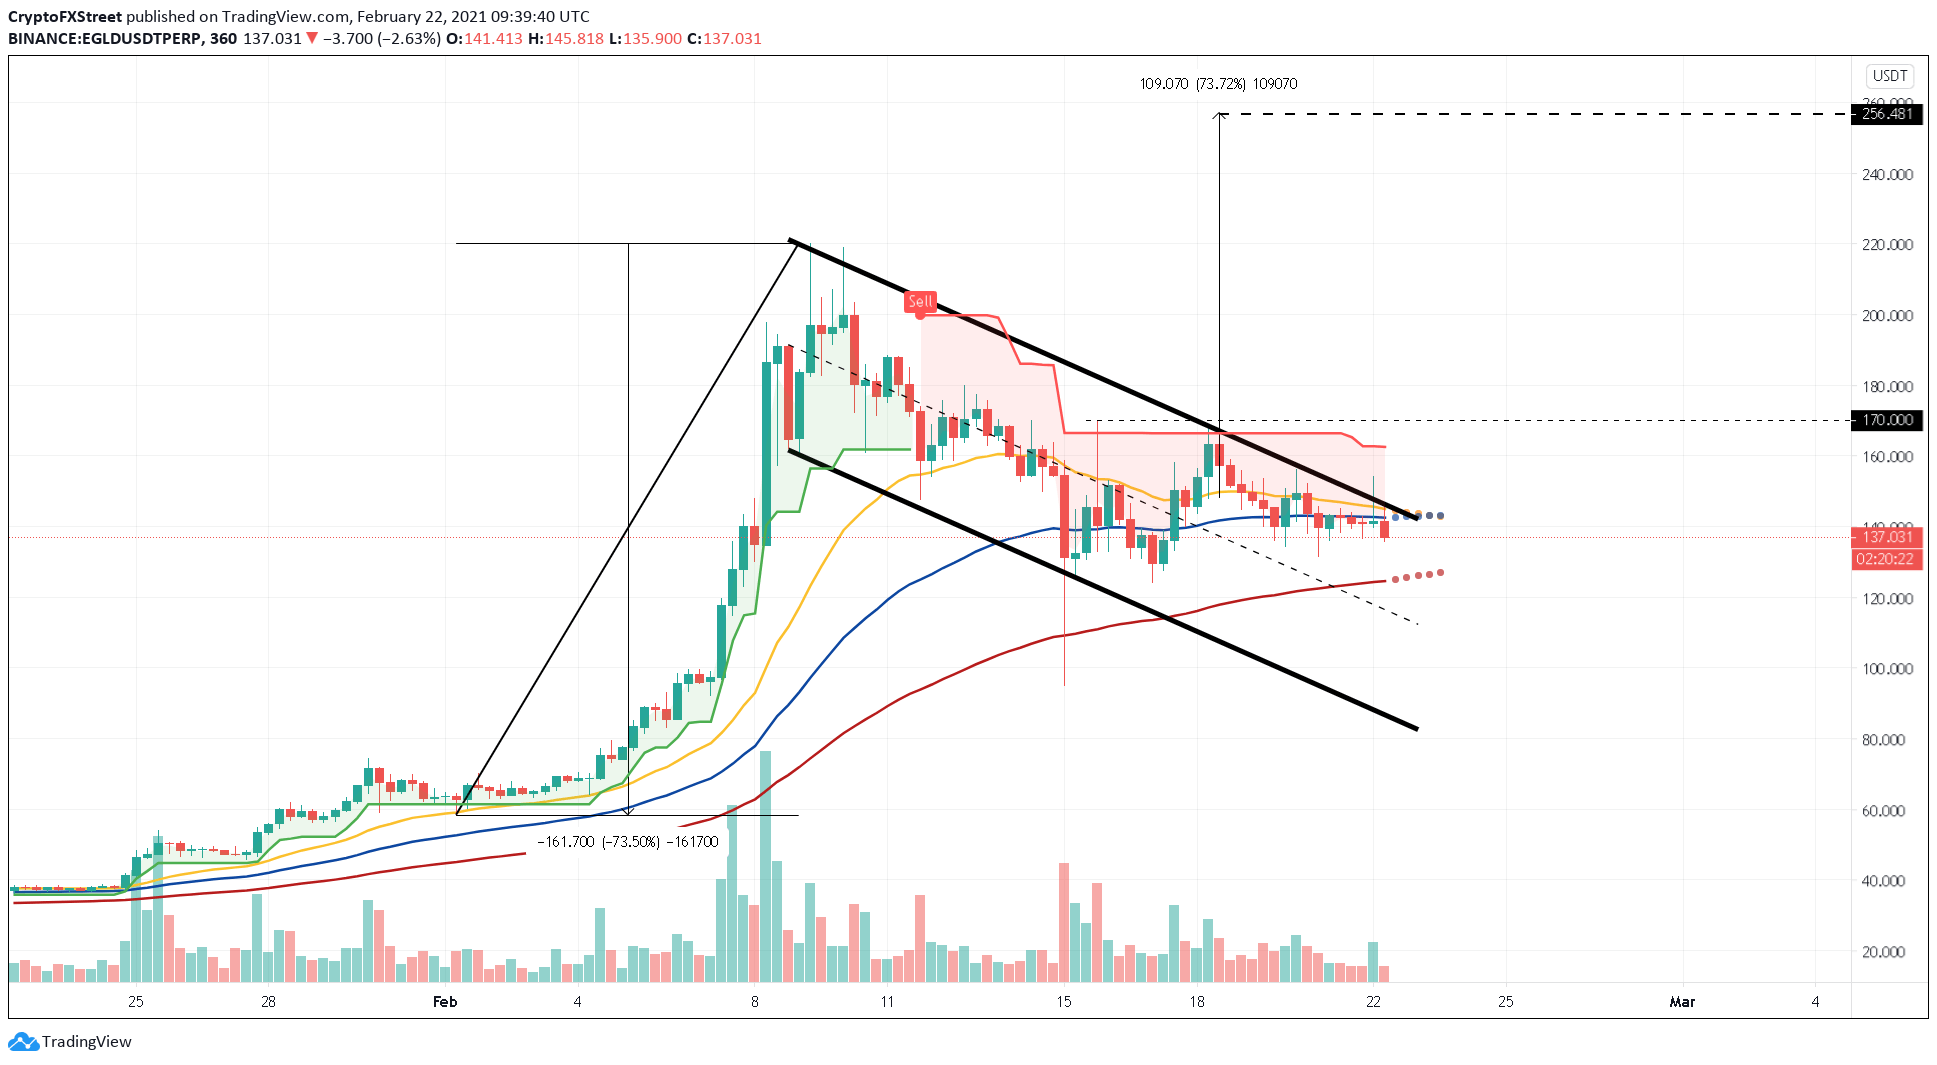
- Elrond price attempts to break out of the bull flag upper trendline for the second time in four days.
- EGLD upswing faces a cloud of resistance around $170, delaying its breakout.
- Bollinger Band convergence shows that Elrond is stuck inside a no-trade zone ranging from $129 to $163.
- A spike in selling pressure could push EGLD below the long-length EMA, triggering a sell-off to $81.

Elrond price faces a collection of resistance from multiple technical indicators as it tries to break out of the bull flag pattern for the second time. A rejection here will prolong EGLD’s consolidation and result in a downtrend.
Elrond price faces prolonged consolidation
Elrond price action from February 1 to-date has resulted in the formation of a bull-flag pattern. The upswing from February 1 to 9 formed a “flag pole” and the consolidation seen since then has developed a “flag.”
The continuation pattern stipulates a bullish trajectory of 73%. This target is the distance between the flagpole's top and the base measured from the breakout point at $141. So, a six-hour candlestick close above $166 will not only signal the end of the bull flag but also hint at the start of a new uptrend.
However, resistance barriers present above the current price level suggest that this breakout will not be a walk in the park. Elrond has faced rejection from the SuperTrend indicator’s buy signal around the $163 level, which has resulted in a dip below the short and medium-length EMAs. Now, EGLD eyes to test the long-length EMA’s support at $125.
EGLD/USDT 6-hour chart
Additionally, Elrond is getting squeezed as the Bollinger Bands converge. As long as EGLD remains in the no-trade zone ranging from $129 to $163, there won’t be any significant price movements. Hence, a six-hour candlestick close above $163 would establish the uptrend’s resumption and concur with the bullish trajectory.
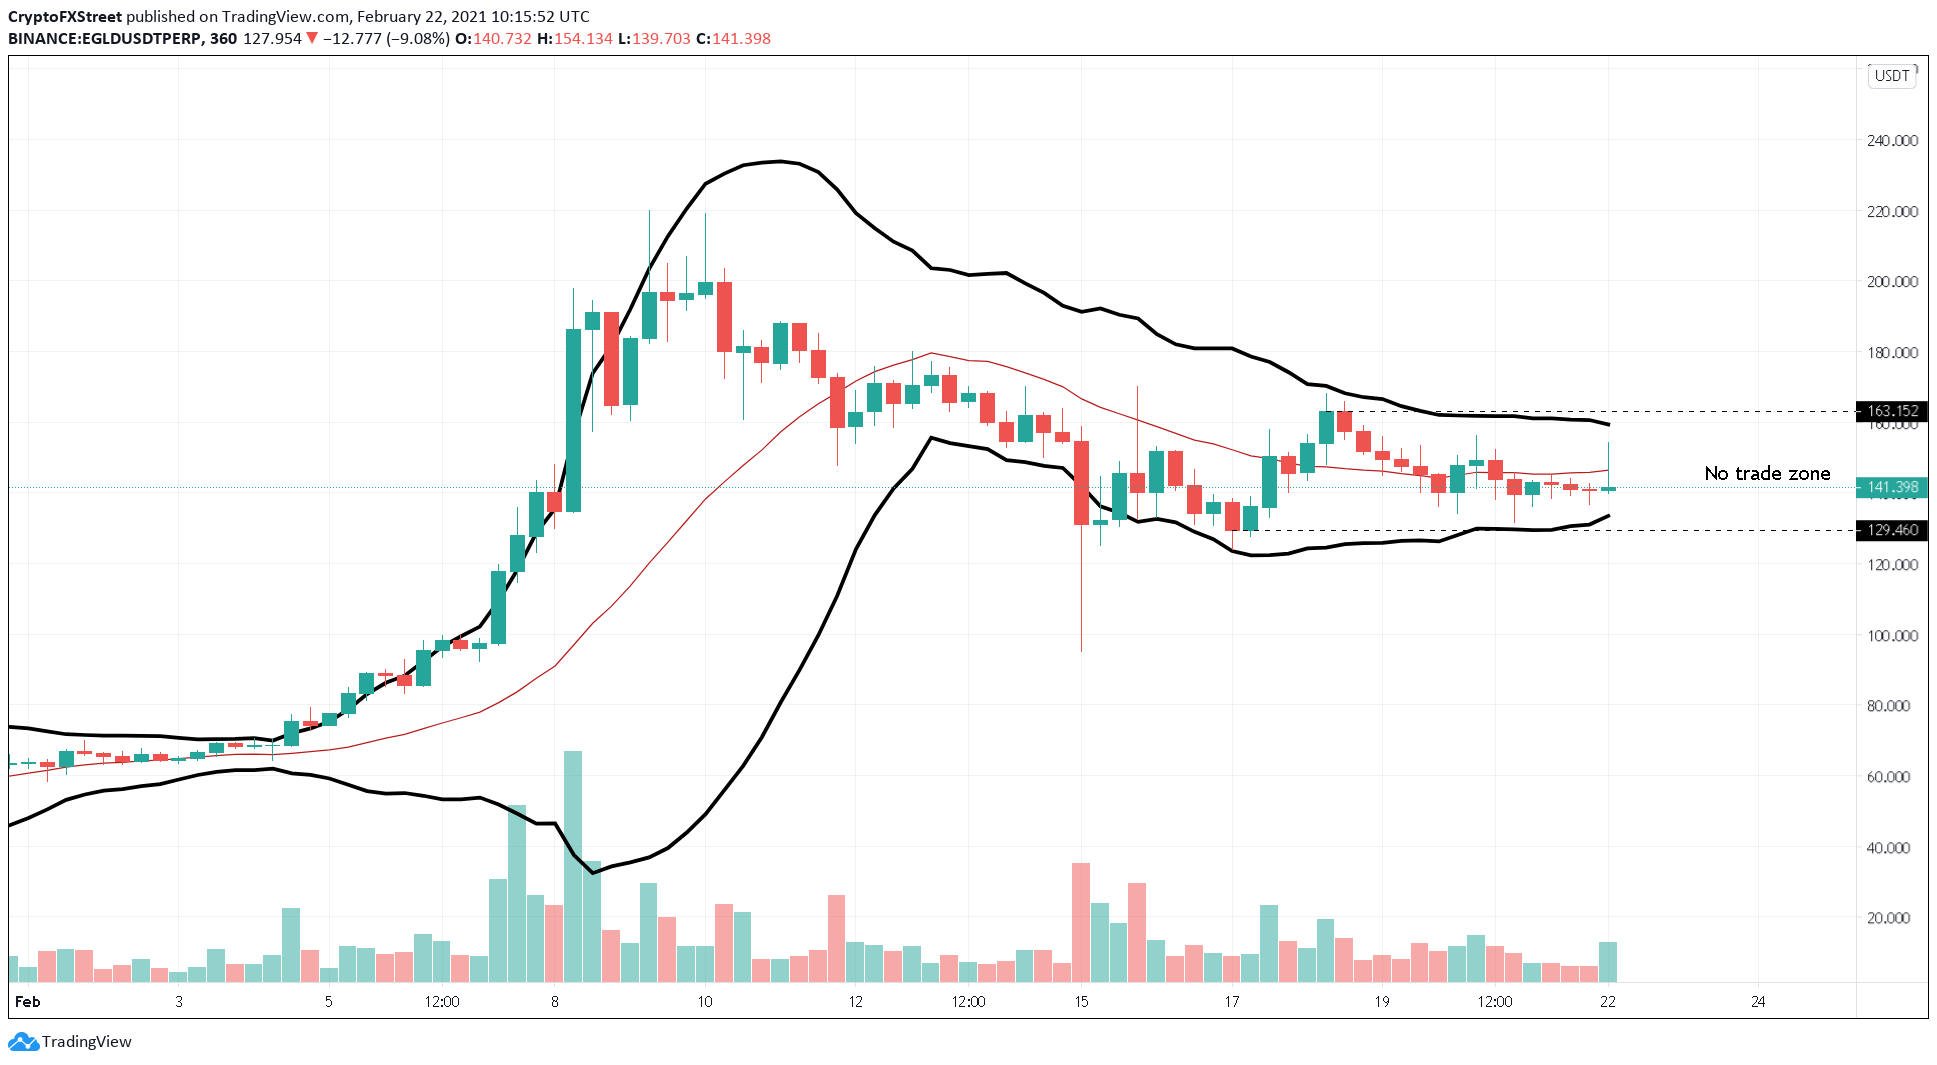
EGLD/USDT 6-hour chart
However, a six-hour candlestick close below $129 would indicate increasing bearish momentum. A breakdown of this support level could trigger a 35% sell-off to $81 or the bull flag lower trendline. At such level, EGLD bulls might give the bullish breakout another go.
Author

Akash Girimath
FXStreet
Akash Girimath is a Mechanical Engineer interested in the chaos of the financial markets. Trying to make sense of this convoluted yet fascinating space, he switched his engineering job to become a crypto reporter and analyst.


