Elrond Price Prediction: EGLD enters calm after massive explosion, before another storm?
- Elrond price has experienced one of the biggest rallies in the past two days.
- A crucial indicator is on the verge of presenting a massive sell signal for EGLD.
- EGLD has reached a $3.3 billion market capitalization, hitting top 20 on CoinMarketCap.

Elrond has been trading inside a massive rally since October 2020 from an all-time low of $6.8 to an all-time high above $200. In the past 48 hours, the digital asset has gained more than $2 billion in market capitalization, placing top 20.
Update February 11: EGLD is trading around $177, up on the day and in the middle of its trading range, which has narrowed in recent hours. Previously, Elrond surged to hit all-time highs before dropping. It is now some $38 from the peak and the battle between bears and bulls rages. Cryptocurrencies do not tend to trade ranges of single digits in percentage points, and EGLD may be experiencing the "calm before the storm." Will buyers seize on low trading volume during the weekend to mount a new attack? The ATH at $215 awaits.
Update: Elrond has been retreating from the highs, trading at around $180 after hitting a high above $215 earlier in the day. As mentioned below, selling pressure on the upstart cryptocurrency has been immense. Nevertheless, it has recovered from the lows of $167 relatively quickly. After entering the top 20 list of cryptos, interest in EGLD has been on the rise. Will bargain-seekers seize the current correction and jump in? One thing seems certain, volatility will likely remain robust.
Elrond price can quickly fall towards $175
On the 6-hour and the 9-hour charts, the TD Sequential indicator has presented two sell signals and it’s on the verge of doing the same on the daily chart, where currently we can see a green ‘8’ candlestick.
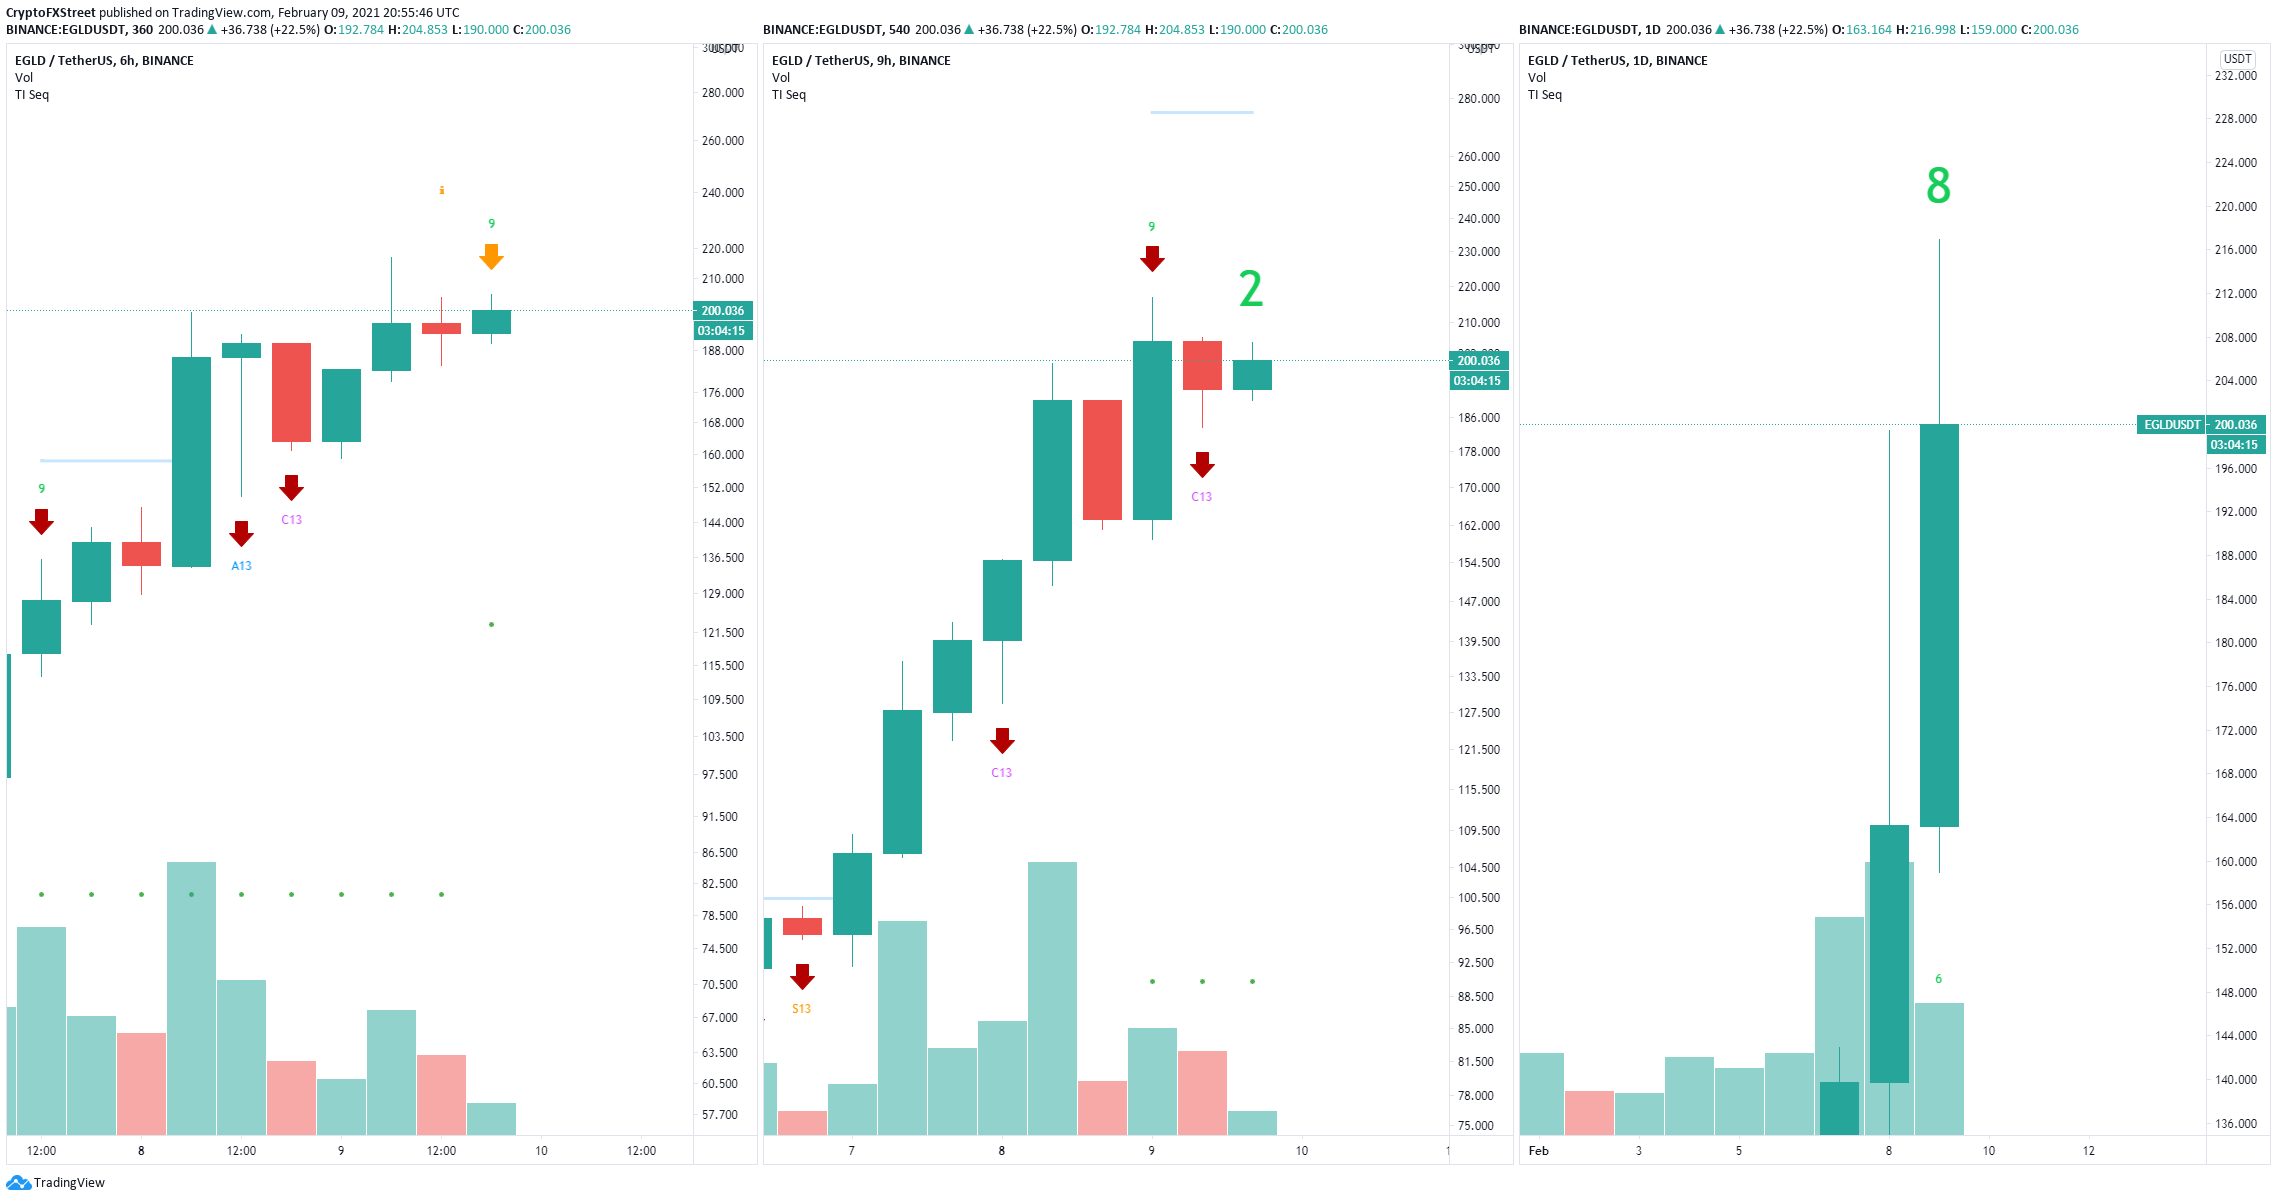
EGLD Sell Signals
If the daily sell signal is confirmed, EGLD can see a massive correction in the short-term as there are no clear support levels on the way down. Using the Fibonacci Retracement tool we can determine several potential price targets for the bears.
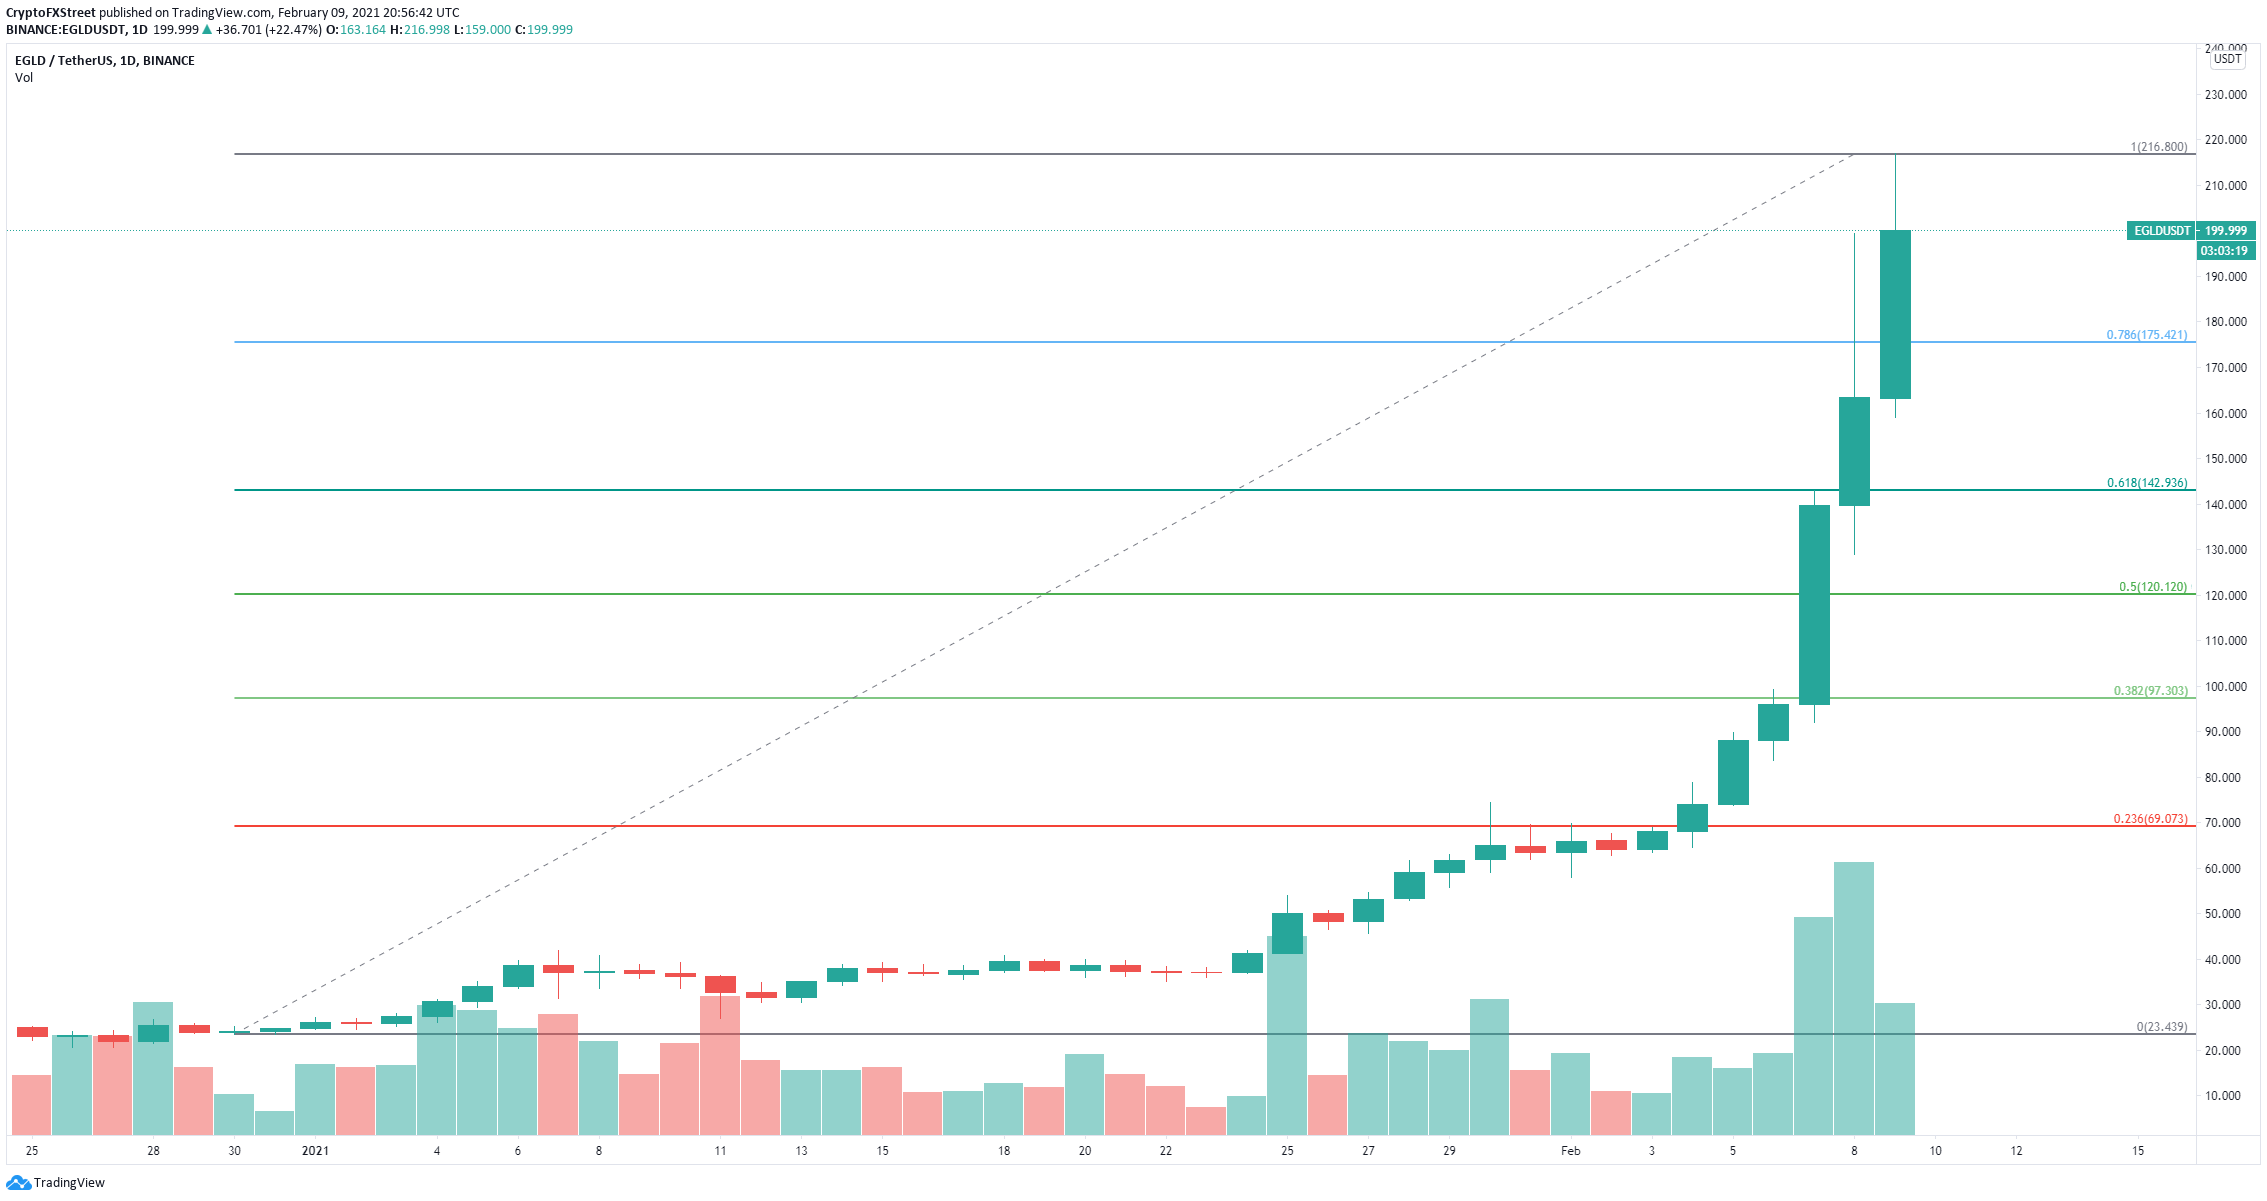
EGLD/USD daily chart
The first potential price target for the bears is located at $175 which is the 78.6% Fibonacci level. The next is established at $143, the 61.8% Fib level. Elrond price can potentially drop towards this level.
Author

Lorenzo Stroe
Independent Analyst
Lorenzo is an experienced Technical Analyst and Content Writer who has been working in the cryptocurrency industry since 2012. He also has a passion for trading.



