- Elrond rejection from the all-time high explores price levels under $100.
- Support at $95, and the 100 SMA is holding EGLD in position ahead of a potential upswing.
- The downtrend will remain intact if Elrond closes the day under the 100 SMA on the 4-hour chart.
Elrond is among the biggest losers in the cryptocurrency market. A bearish wave has seen both small and large coins correct from their recent highs. EGLD’s massive upswing ran into a strong barrier at $225, paving the way to a 60% breakdown below $100. Meanwhile, bulls seem to be working on a recovery mission as long the primary support holds firmly.
Elrond downtrend is nearing exhaustion
The breakdown from the all-time high failed to secure support at the 61.8% Fibonacci retracement level, taken between the last swing high at $225 to a swing of $96.2. The bearish leg progressed under $100 before Elrond bounced off the 23.6% Fibo.
At the time of writing, EGLD is dancing at $140 after reclaiming the lost ground above the 100 Simple Moving Average (SMA) on the 4-hour chart. Elrond must close the day above this key moving average to sustain the ongoing recovery. Notably, massive buy orders will be triggered if the token steps above either the 61.8% Fibo or the 50 SMA.
The Relative Strength Index (RSI) on the 4-hour chart has validated the rebound after bouncing off the oversold area. A continued movement toward the midline will cement the bulls’ influence over the price.
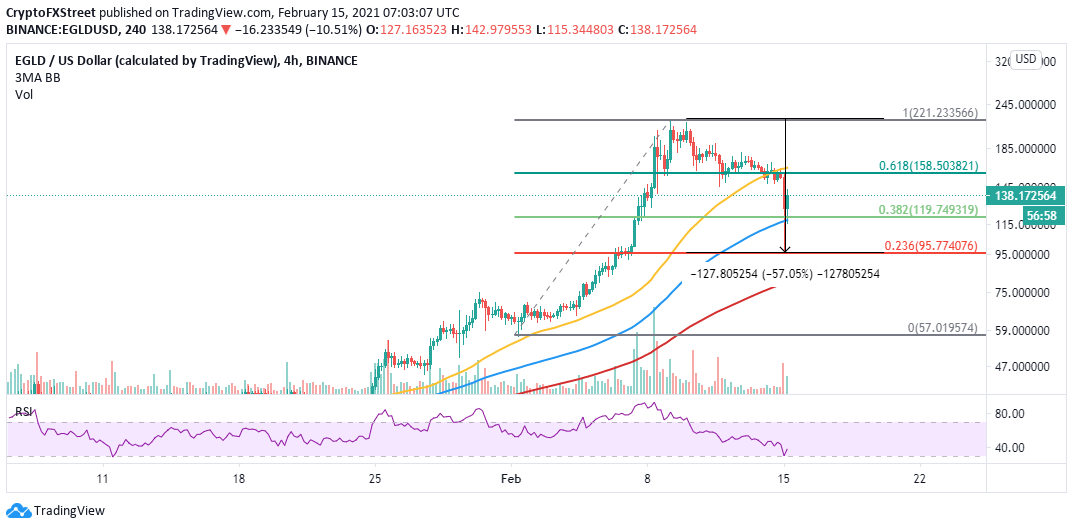
EGLD/USD 4-hour chart
Looking at the other side of the picture
Elrond is not out of the woods yet, and therefore, it is essential to tread with caution. If the uptrend cannot be sustained above the 100 SMA on the 4-hour chart, another retracement will take precedence. The support at the 23.6% Fibo near $95 would also be retested. A break under this zone may open the Pandora box as bears rush to push for losses toward the 200 SMA.
Information on these pages contains forward-looking statements that involve risks and uncertainties. Markets and instruments profiled on this page are for informational purposes only and should not in any way come across as a recommendation to buy or sell in these assets. You should do your own thorough research before making any investment decisions. FXStreet does not in any way guarantee that this information is free from mistakes, errors, or material misstatements. It also does not guarantee that this information is of a timely nature. Investing in Open Markets involves a great deal of risk, including the loss of all or a portion of your investment, as well as emotional distress. All risks, losses and costs associated with investing, including total loss of principal, are your responsibility. The views and opinions expressed in this article are those of the authors and do not necessarily reflect the official policy or position of FXStreet nor its advertisers. The author will not be held responsible for information that is found at the end of links posted on this page.
If not otherwise explicitly mentioned in the body of the article, at the time of writing, the author has no position in any stock mentioned in this article and no business relationship with any company mentioned. The author has not received compensation for writing this article, other than from FXStreet.
FXStreet and the author do not provide personalized recommendations. The author makes no representations as to the accuracy, completeness, or suitability of this information. FXStreet and the author will not be liable for any errors, omissions or any losses, injuries or damages arising from this information and its display or use. Errors and omissions excepted.
The author and FXStreet are not registered investment advisors and nothing in this article is intended to be investment advice.
Recommended Content
Editors’ Picks
Ripple's move above this key level could trigger nearly 50% rally for XRP
Ripple has overcome a critical resistance level and flipped into a support floor on the weekly time frame. This development happened while XRP tightly consolidated for roughly 250 days. Investors can expect XRP to kickstart a massive rally.
Optimism price outlook with nearly $90 million worth of OP tokens flooding markets on Friday
Optimism volatility has shrunk in the ours leading to the network’s cliff unlock. It joins the likes of dYdX and Sui, which have similar events on their calendars. As token unlocks are often considered bearish catalysts, investors should brace for a reaction after the event.
Top 3 Price Prediction Bitcoin, Ethereum, Ripple: Retail watches from the sidelines with a bias for shorts
Bitcoin could clear $73,777 peak as BTC bulls resurface. Ethereum might fall 10% before next leg up as ETH RSI teases with sell signal. XRP could lose $0.6000 threshold as Ripple bulls fail to show up.
Jito price could hit $6 as JTO coils up inside this bullish pattern
Jito price action shows a potential cup and handle formation. Based on theoretical measurement rules, a successful breakout could yield a 56% rally to $6.0. A breakdown of the $3.86 support level would create a lower low for JTO and invalidate the bullish thesis.
Bitcoin: BTC may have recovered, but is it out of the woods?
Bitcoin’s (BTC) upward momentum has shown a significant decline for the past two weeks or so. This development led to a bearish signal on the weekly and an uncertain outlook on the monthly.