Dogecoin price with its back to the wall, as DOGE edges closer to an 80% decline
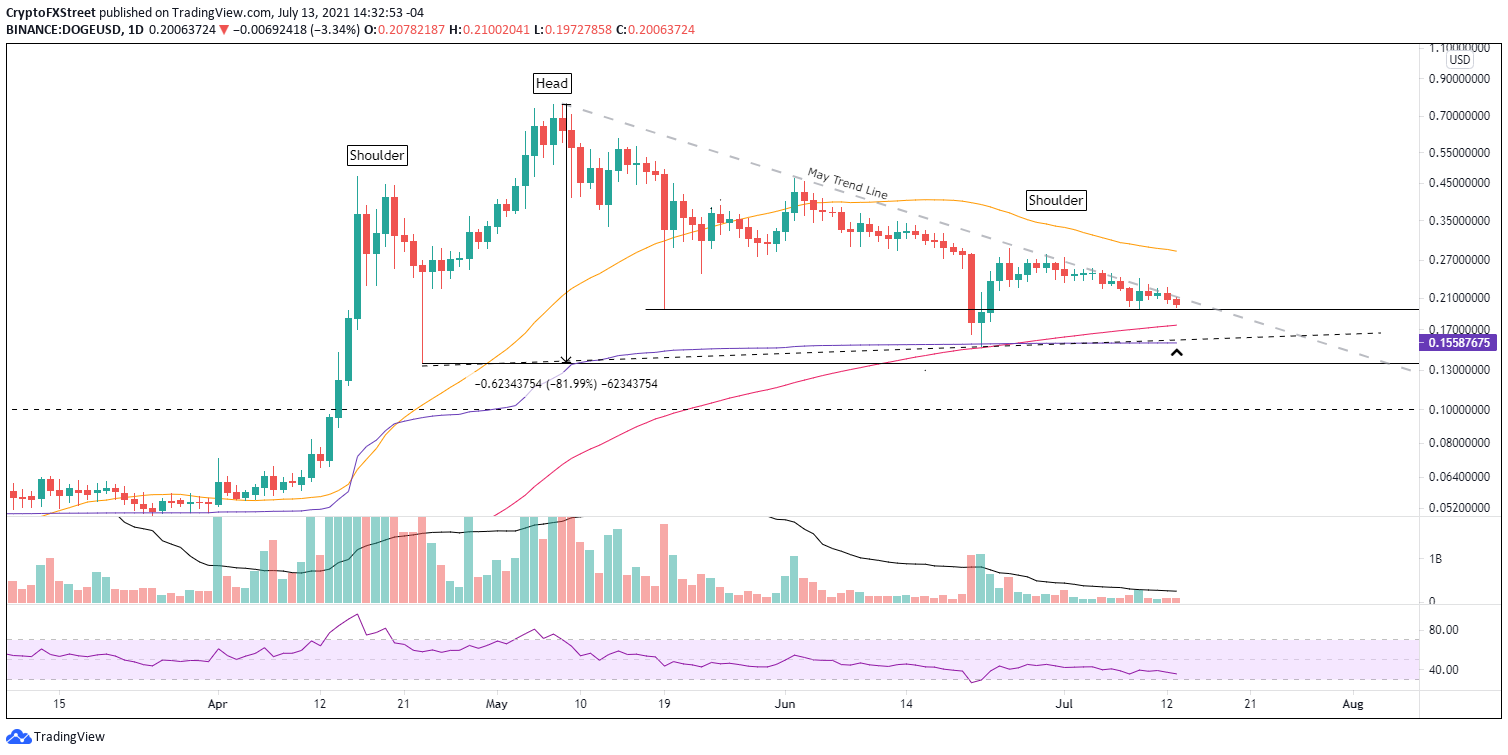
- Dogecoin price has finalized a head-and-shoulders pattern with a measured move of over 80%.
- DOGE investors are unable to unlock the unrelenting resistance defined by May’s descending trend line.
- Anchored VWAP from January 28 aligns with the neckline at $0.155, creating a barrier against bearish aspirations.

Dogecoin price has featured an uneventful investment environment since the June 25 rebound high as May’s descending trend line has successfully halted each daily rally attempt. As long as the trend line maintains its technical presence, DOGE is projected to continue erasing the 95% rebound off the 200-day simple moving average (SMA) on June 22 and trigger the head-and-shoulders pattern.
Dogecoin price has to make a choice soon
The emerging head-and-shoulders pattern offers an alternative bearish twist to the price structure that has evolved since April and establishes a firm entry price should Dogecoin price pursue lower levels moving forward. Enforcing the right shoulder’s resistance is May’s descending trend line, currently at $0.209, formalizing an unprecedented technical obstacle for DOGE over the last two weeks.
The measured move of the head-and-shoulders pattern is 82%, fixing the DOGE price target at $0.028 and leaving Dogecoin price back at levels last seen in early February. It would be a remarkable conclusion to one of the most interesting and polarizing stories in the cryptocurrency complex during 2021.
A DOGE decline to the target price is not a slamdunk. Dogecoin price will need to overcome the layered support specified by the May 19 low of $0.195, the 200-day SMA at $0.175, the Anchored VWAP and neckline at $0.155, and the April 23 low of $0.135. A drop to the April 23 low would equal a 30% loss from the current price and represent a more realistic target if the meme token finally chooses a bearish resolution to the stagnating price action.
Should the cryptocurrency market suffer a widespread sell-off, Dogecoin price will be attracted to the support produced by the January 29 high of $0.029.
DOGE/USD daily chart
DOGE investors can entertain a better outcome for Dogecoin price if they log a daily close above $0.229. It may release the digital asset to test the declining 50-day SMA at $0.286, offering a 20% gain from $0.229.
Dogecoin price has fallen in line with the realities of the charts, leaving behind the period of unstoppable gains fueled by FOMO. As a result, DOGE is slowly being cornered into another collapse that would erase a large percentage of the 2021 gains.
With DOGE’s back against the wall, it is essential to reiterate that past performance is no guarantee of future results.
Here, FXStreet's analysts evaluate where DOGE could be heading next.
Author

Sheldon McIntyre, CMT
Independent Analyst
Sheldon has 24 years of investment experience holding various positions in companies based in the United States and Chile. His core competencies include BRIC and G-10 equity markets, swing and position trading and technical analysis.


