Dogecoin price to enter relief rally if this key support level holds
- Dogecoin price could be aiming to reverse the period of underperformance if it holds above the 200 three-day SMA.
- The bulls may aim to target the upper boundary of the governing technical pattern next.
- However, DOGE may face multiple resistances ahead before the optimistic target can be reached.

Dogecoin price is counting on a critical line of defense to hold before a relief rally could be in the offing. If the DOGE bulls manage to reverse the period of underperformance, the canine-themed token could possibly tag the upper boundary of the governing technical pattern at $0.24.
Dogecoin price attempts to escape downtrend
Dogecoin price fate has been sealed within a descending parallel channel as the token has failed to galvanize investors’ enthusiasm. However, the Arms Index (TRIN), which gauges overall market sentiment suggests that there are more buyers than sellers in the market.
Dogecoin price could enter into a relief rally toward the upper boundary of the governing technical pattern at $0.24, resulting in a 71% climb if it manages to sustain above the 200 three-day Simple Moving Average (SMA) at $0.13.
The first obstacle for Dogecoin price may emerge at the 21 three-day SMA at $0.15, then at the middle boundary of the prevailing chart pattern at $0.16, coinciding with the 23.6% Fibonacci retracement level.
Additional hurdles may appear at the 50 three-day SMA at $0.19 next, coinciding with the 38.2% Fibonacci retracement level, then at the 50% retracement level at $0.22.
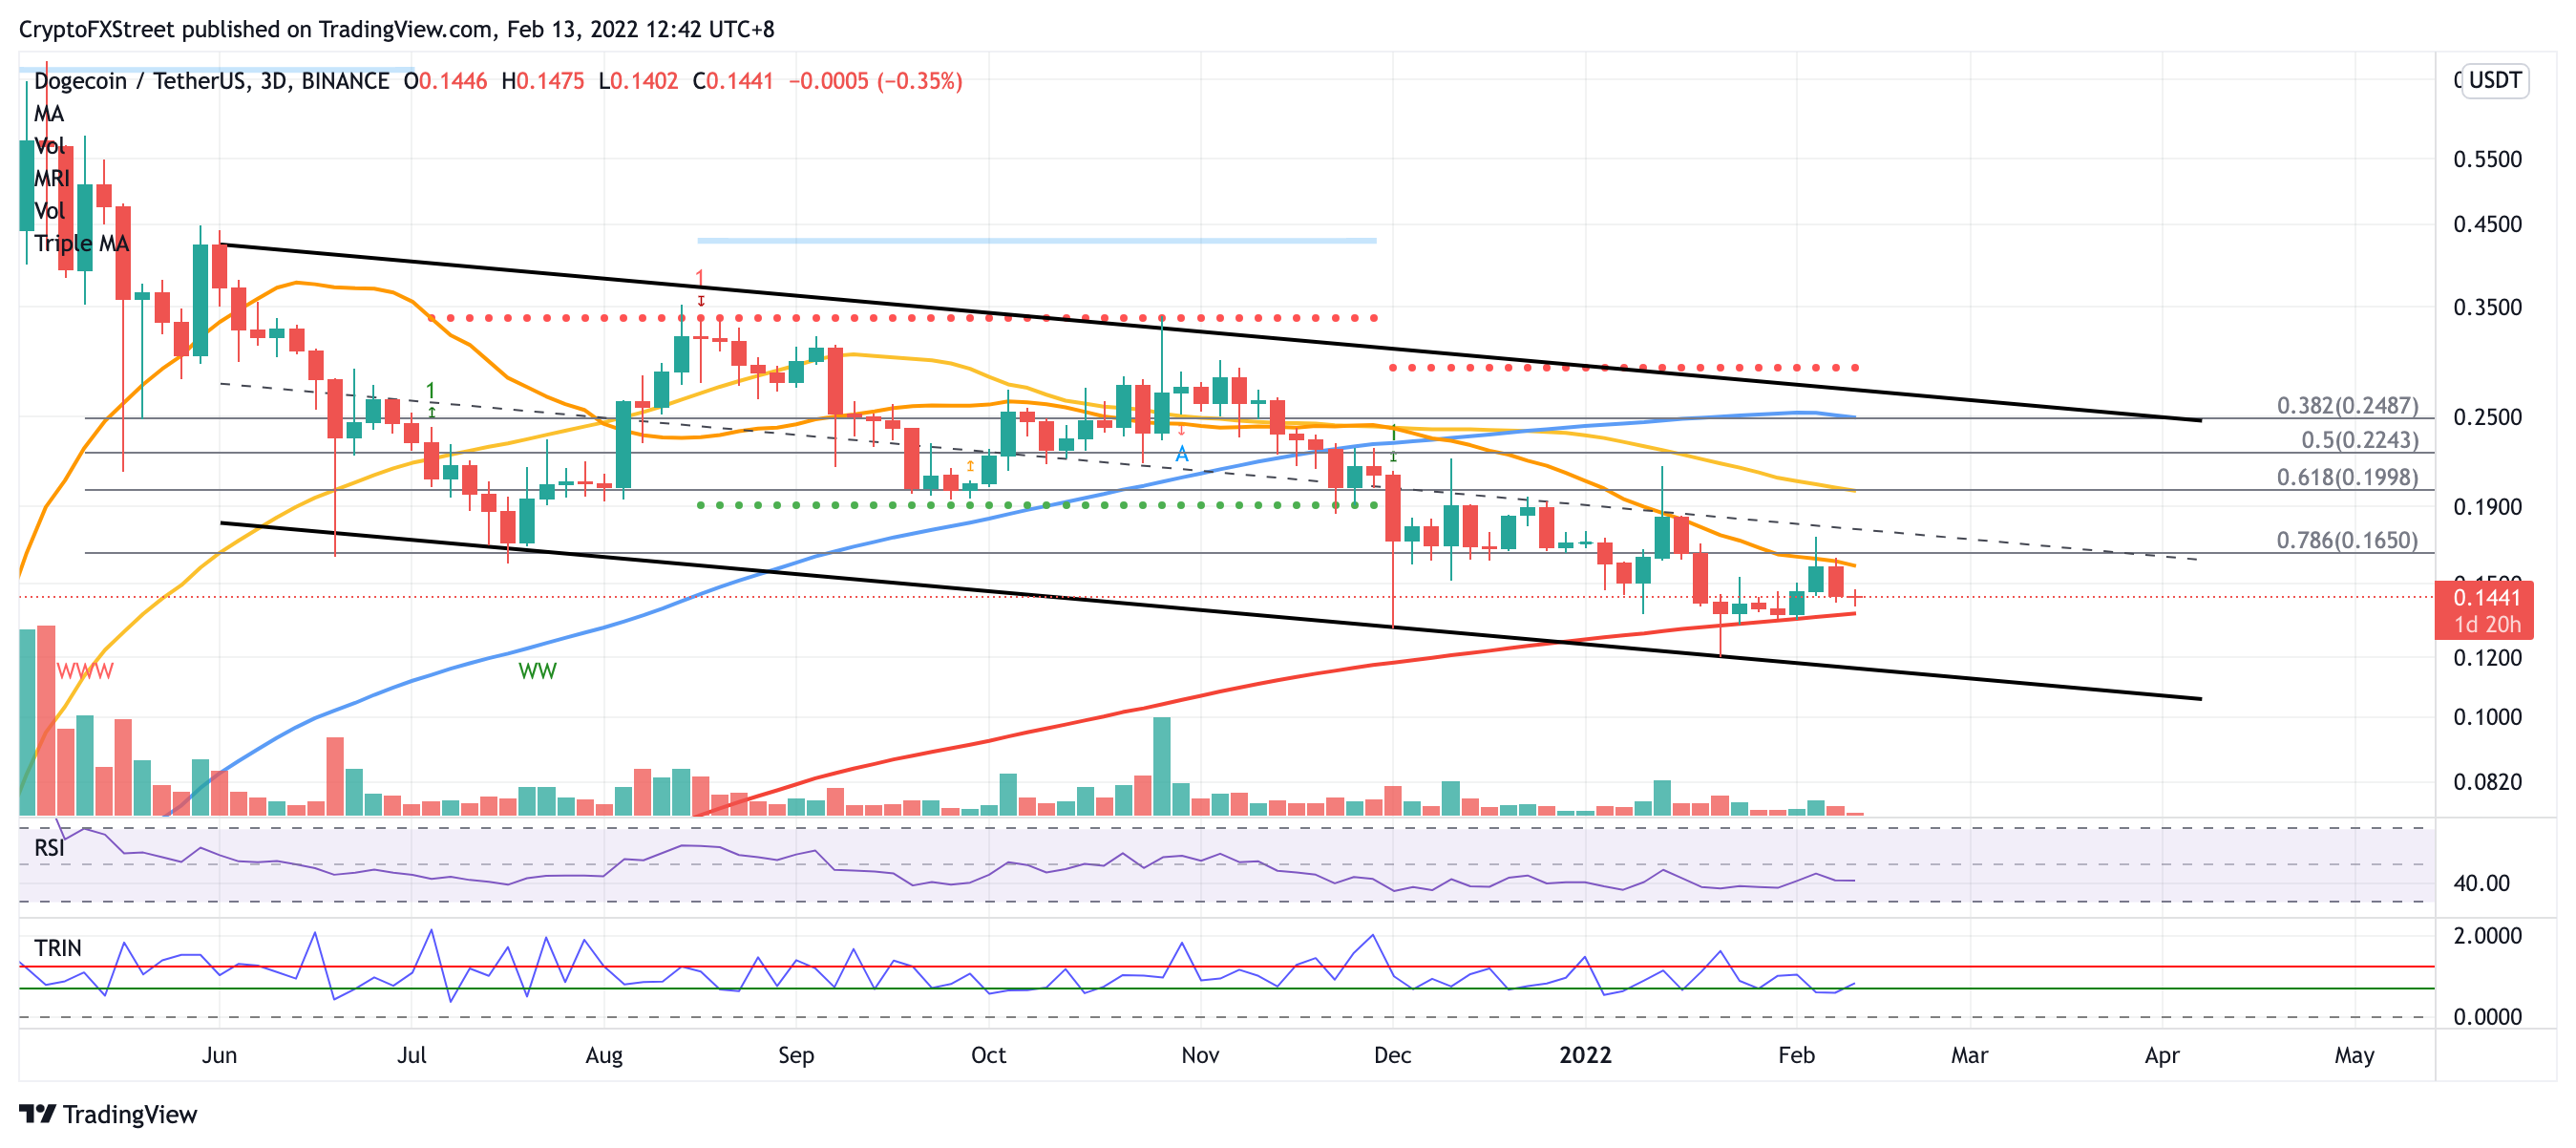
DOGE/USDT 3-day chart
An increase in buying pressure may see Dogecoin price tag the bullish target at $0.24, where the upper boundary of the parallel channel is located.
However, if a spike in sell order occurs, Dogecoin price may test the 200 three-day SMA at $0.13 as immediate support. If this level fails to hold, DOGE may fall toward the January 22 low at $0.12 next.
If selling pressure continues to increase, Dogecoin price may slide toward the lower boundary of the governing technical pattern at $0.11 next.
Author

Sarah Tran
Independent Analyst
Sarah has closely followed the growth of blockchain technology and its adoption since 2016.



