Dogecoin price to enter buy zone before DOGE returns to $0.23
- Dogecoin price has, at the very least, a strong mean reversion setup higher in the near term.
- Point and Figure confirms a bullish entry and compliments the extended levels on the weekly Japanese candlestick chart.
- Limited downside risks present versus potential upside gains.

Dogecoin price has several warning signs on its weekly chart that price action has extended a little too far south too fast. The candlesticks and corresponding oscillators indicate an imminent reversal – likely a broader bullish trend change but, if not, at the very least, a strong pullback.
Dogecoin price set to rally more than 70% if conditions are right
Dogecoin price has been one of the most beat-up altcoins and meme coins in the entire cryptocurrency space. However, in a downtrend exceeding 300 days, some signs point to relief ahead. The most glaring sign of an impending rally is the large gaps between the bodies of the weekly candlesticks and the Tenkan-Sen – gaps between these two levels do not last long and often correct within four to six periods.
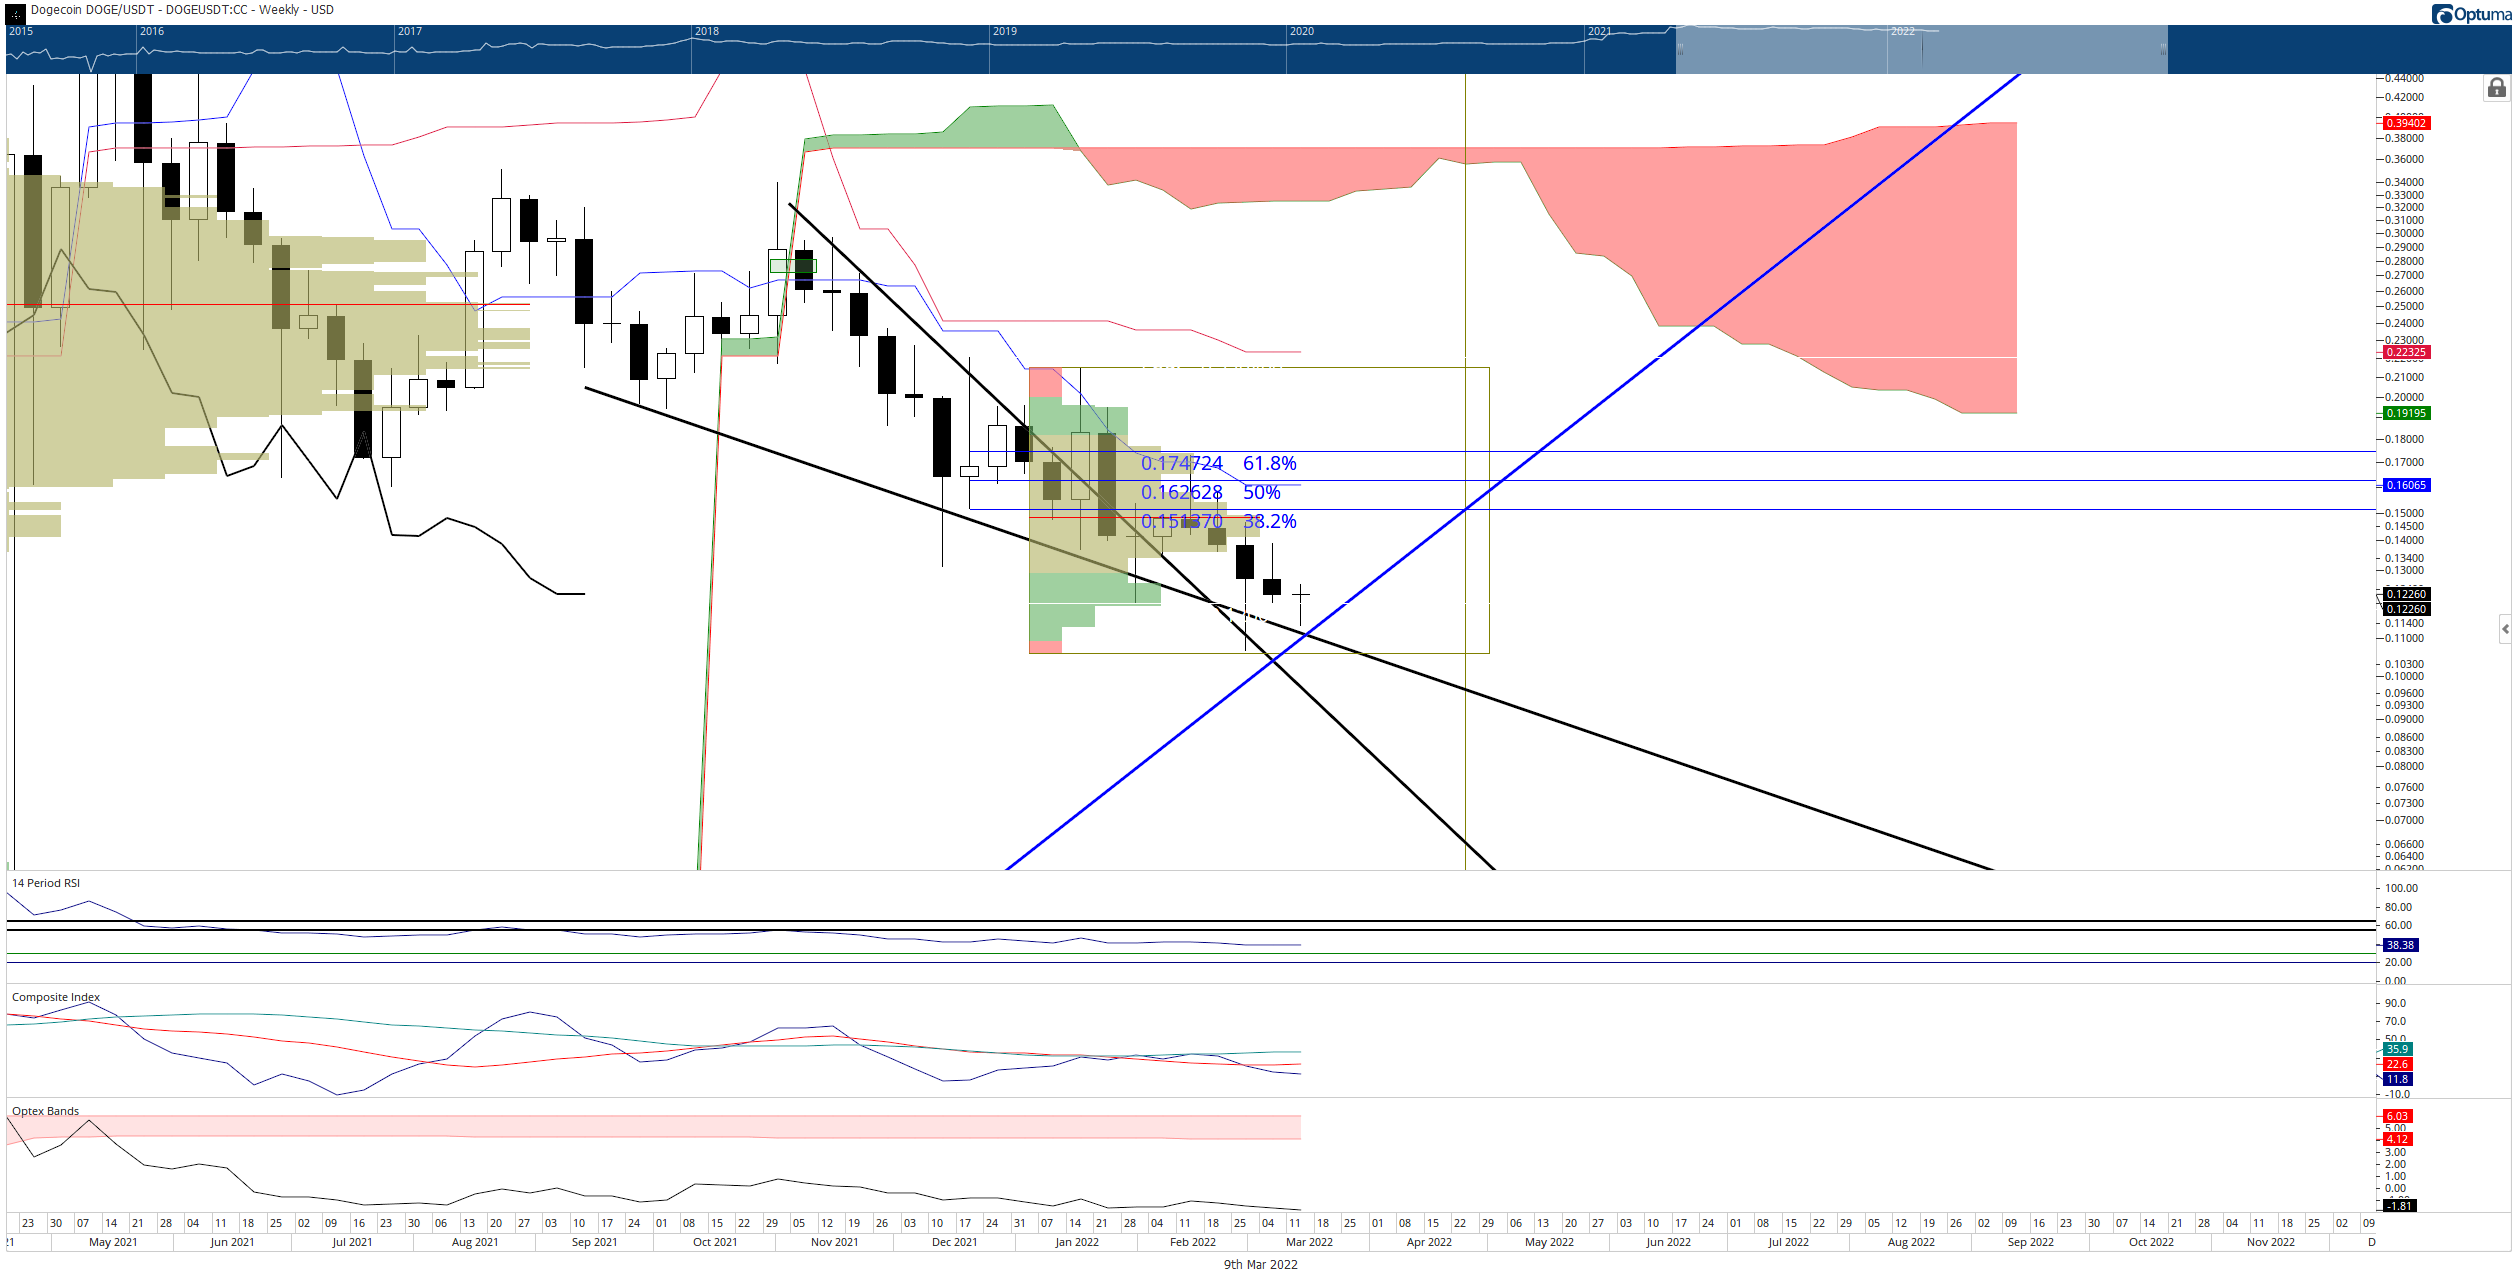
DOGE/USDT Weekly Ichimoku Kinko Hyo Chart
Additionally, Dogecoin price has moved to the maximum mean from the Kijun-Sen on the weekly chart, indicating extreme oversold conditions and a likely return beyond the Tenkan-Sen to the Kijun-Sen at $0.23. Dogecoin’s oscillators support a strong rally. The Optex Bands are at historical all-time lows, while the Composite Index displays regular bullish divergence at extreme lows.
A theoretical long entry exists for Dogecoin price on the $0.005/3-box reversal Point and Figure chart. The long setup is a buy stop order at $0.145, a stop loss at $0.125, and a profit target at $0.23. The trade idea represents a 3.4:1 reward for the risk with an implied profit target of over 60% from the entry. However, the profit targets are rarely hit immediately after entry, so a trailing stop of three boxes would help protect any profit made post entry.
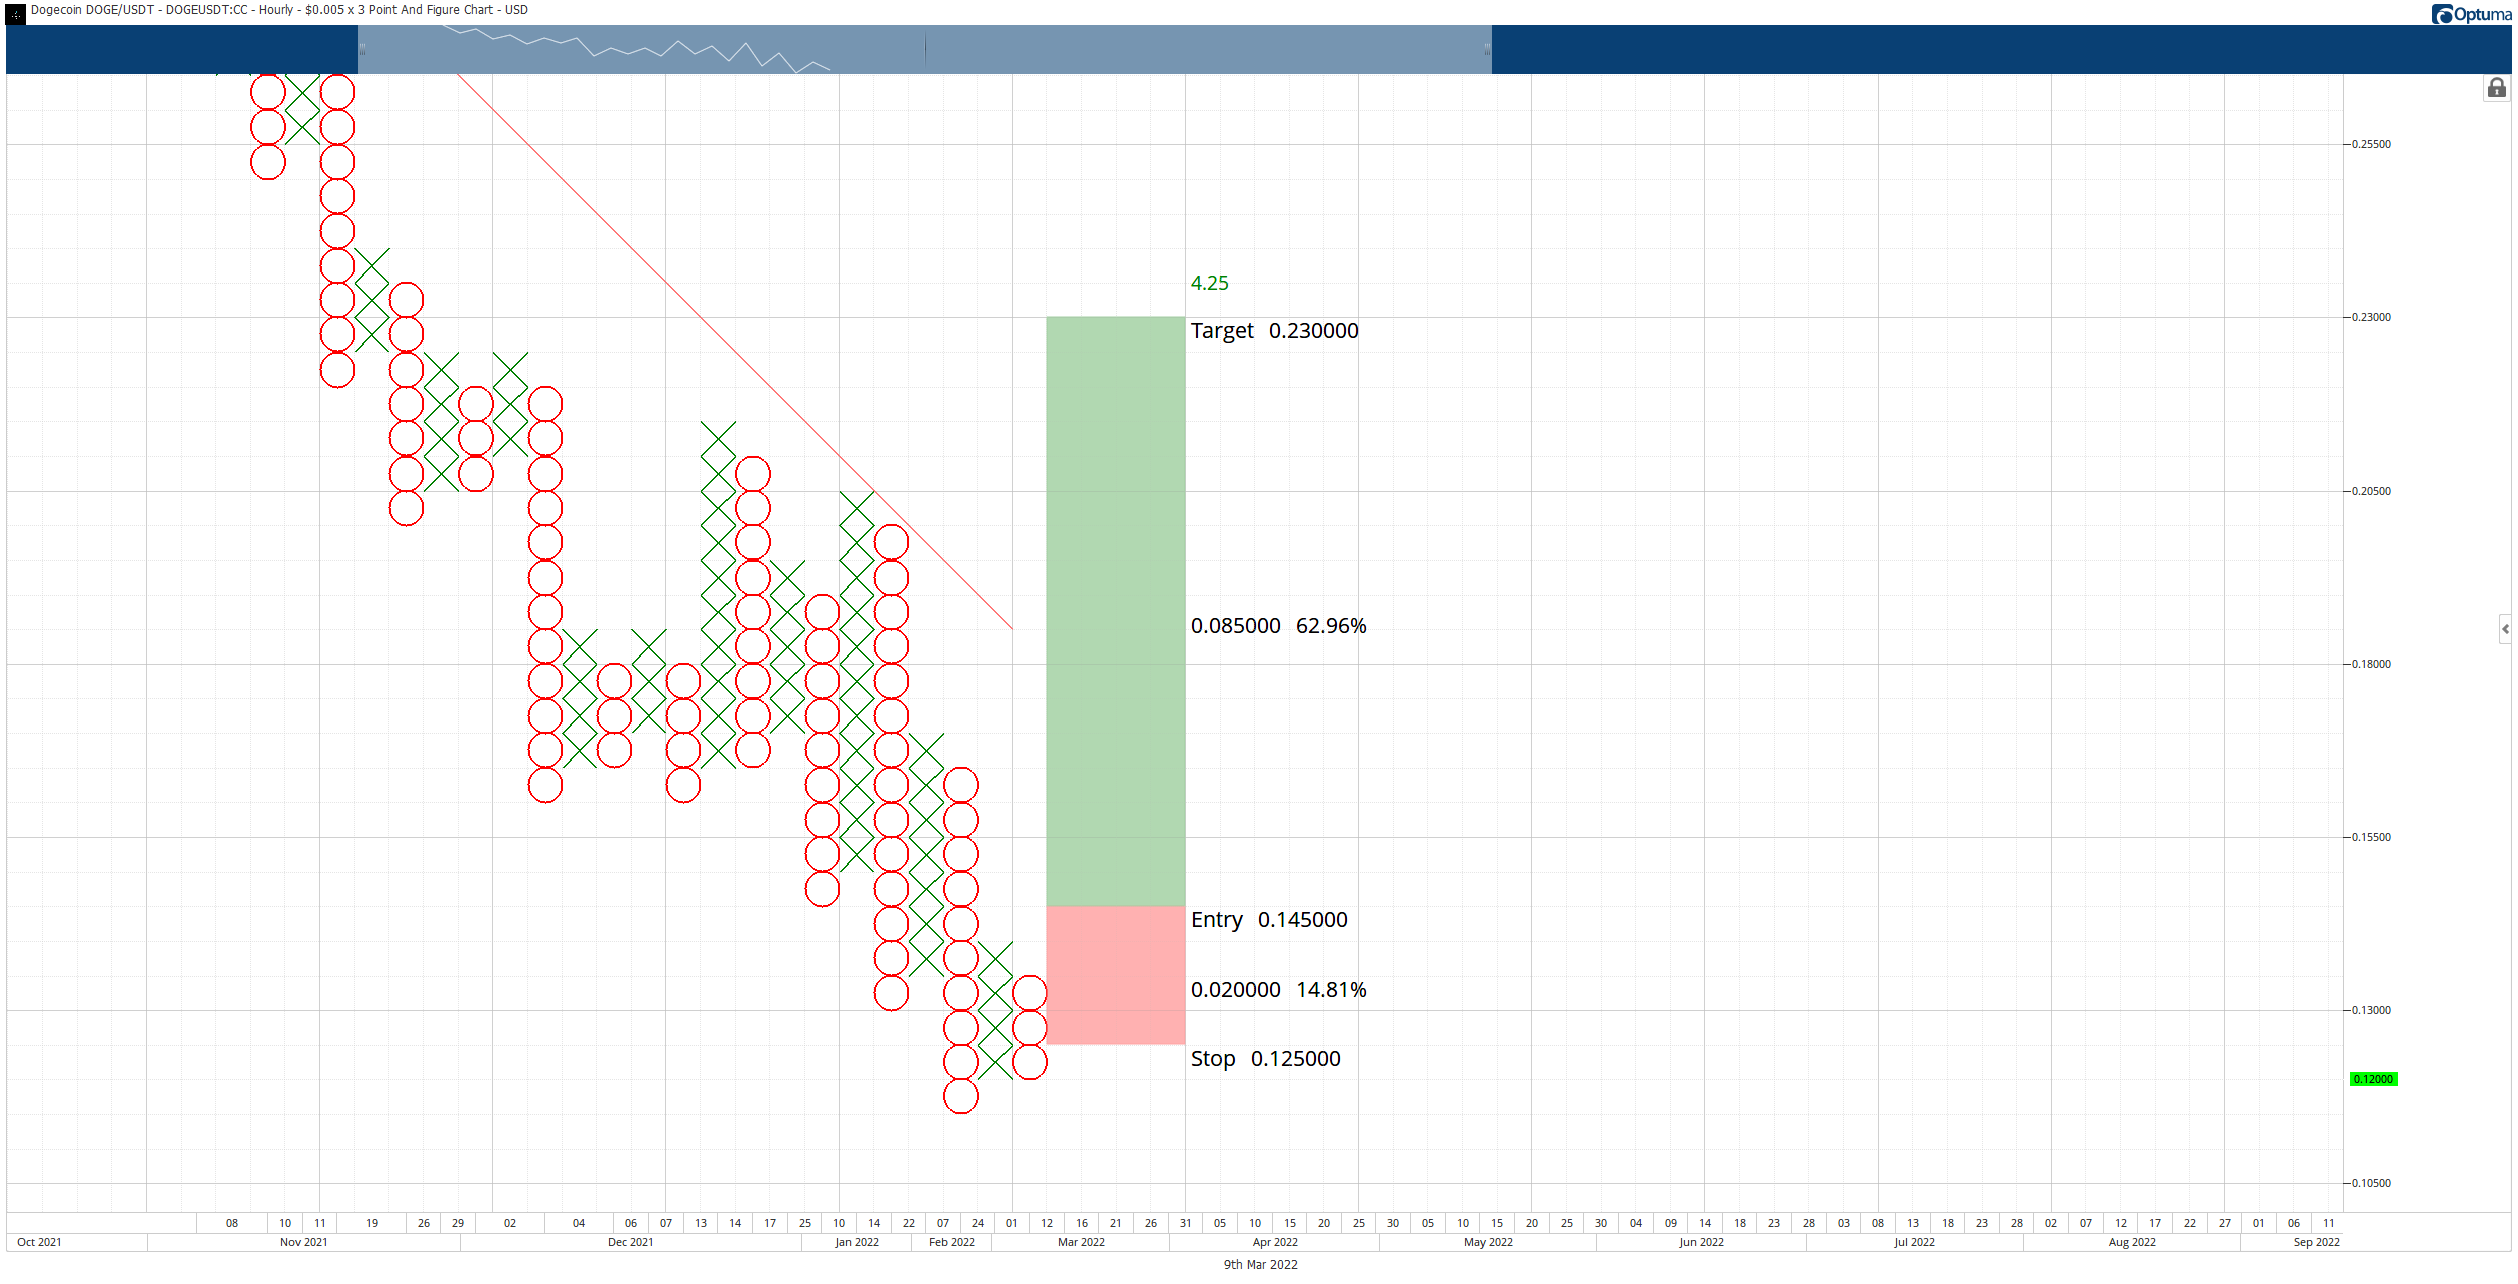
DOGE/USDT $0.005/3-box Reversal Point and Figure Chart
The long trade setup is invalidated if Dogecoin price falls to $0.11 before the entry is triggered.
Author

Jonathan Morgan
Independent Analyst
Jonathan has been working as an Independent future, forex, and cryptocurrency trader and analyst for 8 years. He also has been writing for the past 5 years.



