Dogecoin Price Prediction: DOGE to explode soon
- Dogecoin price shows a breakout from a three-month downtrend, signaling a potential rally.
- The twelve-hour and the three-day charts both show clear buy signals..
- A decisive breakdown of the $0.0631 support level will invalidate the bullish thesis for DOGE.

Dogecoin (DOGE) price has been on a downtrend for almost three months, but technical indicators suggest this could change soon. A breakout on June 30 shows that DOGE is ready for a rally.
Read more: Dogecoin Price Prediction: DOGE edges closer to 20% breakout
Dogecoin price sets the stage for an upturn
Dogecoin (DOGE) price has been on a downward trend for nearly three months. A trend line connecting the swing highs also shows a declining resistance level. On June 30, DOGE breached this line, indicating that bulls are back in action.
Additionally, the twelve-hour chart shows quite a few bullish signs for DOGE. The Wave Trend indicator has flashed a buy signal along with a bullish divergence. The Relative Strength Index (RSI) has flipped above the mean line at 50, indicating the momentum is largely in favor of bulls. Likewise, the Awesome Oscillator (AO) has also started setting up taller green histograms above the zero line.
All of these hints likely indicate that bulls are making a comeback.
Hence, a breakout rally for Dogecoin price could see it target the buy-side liquidity above the equal highs at $0.0727. A sweep above the aforementioned level would mean a 7.15% increase from current price levels of around $0.0679.
If the buying momentum is strong enough, Dogecoin price could register a 20% rise and collect the buy-side liquidity above $0.0814.
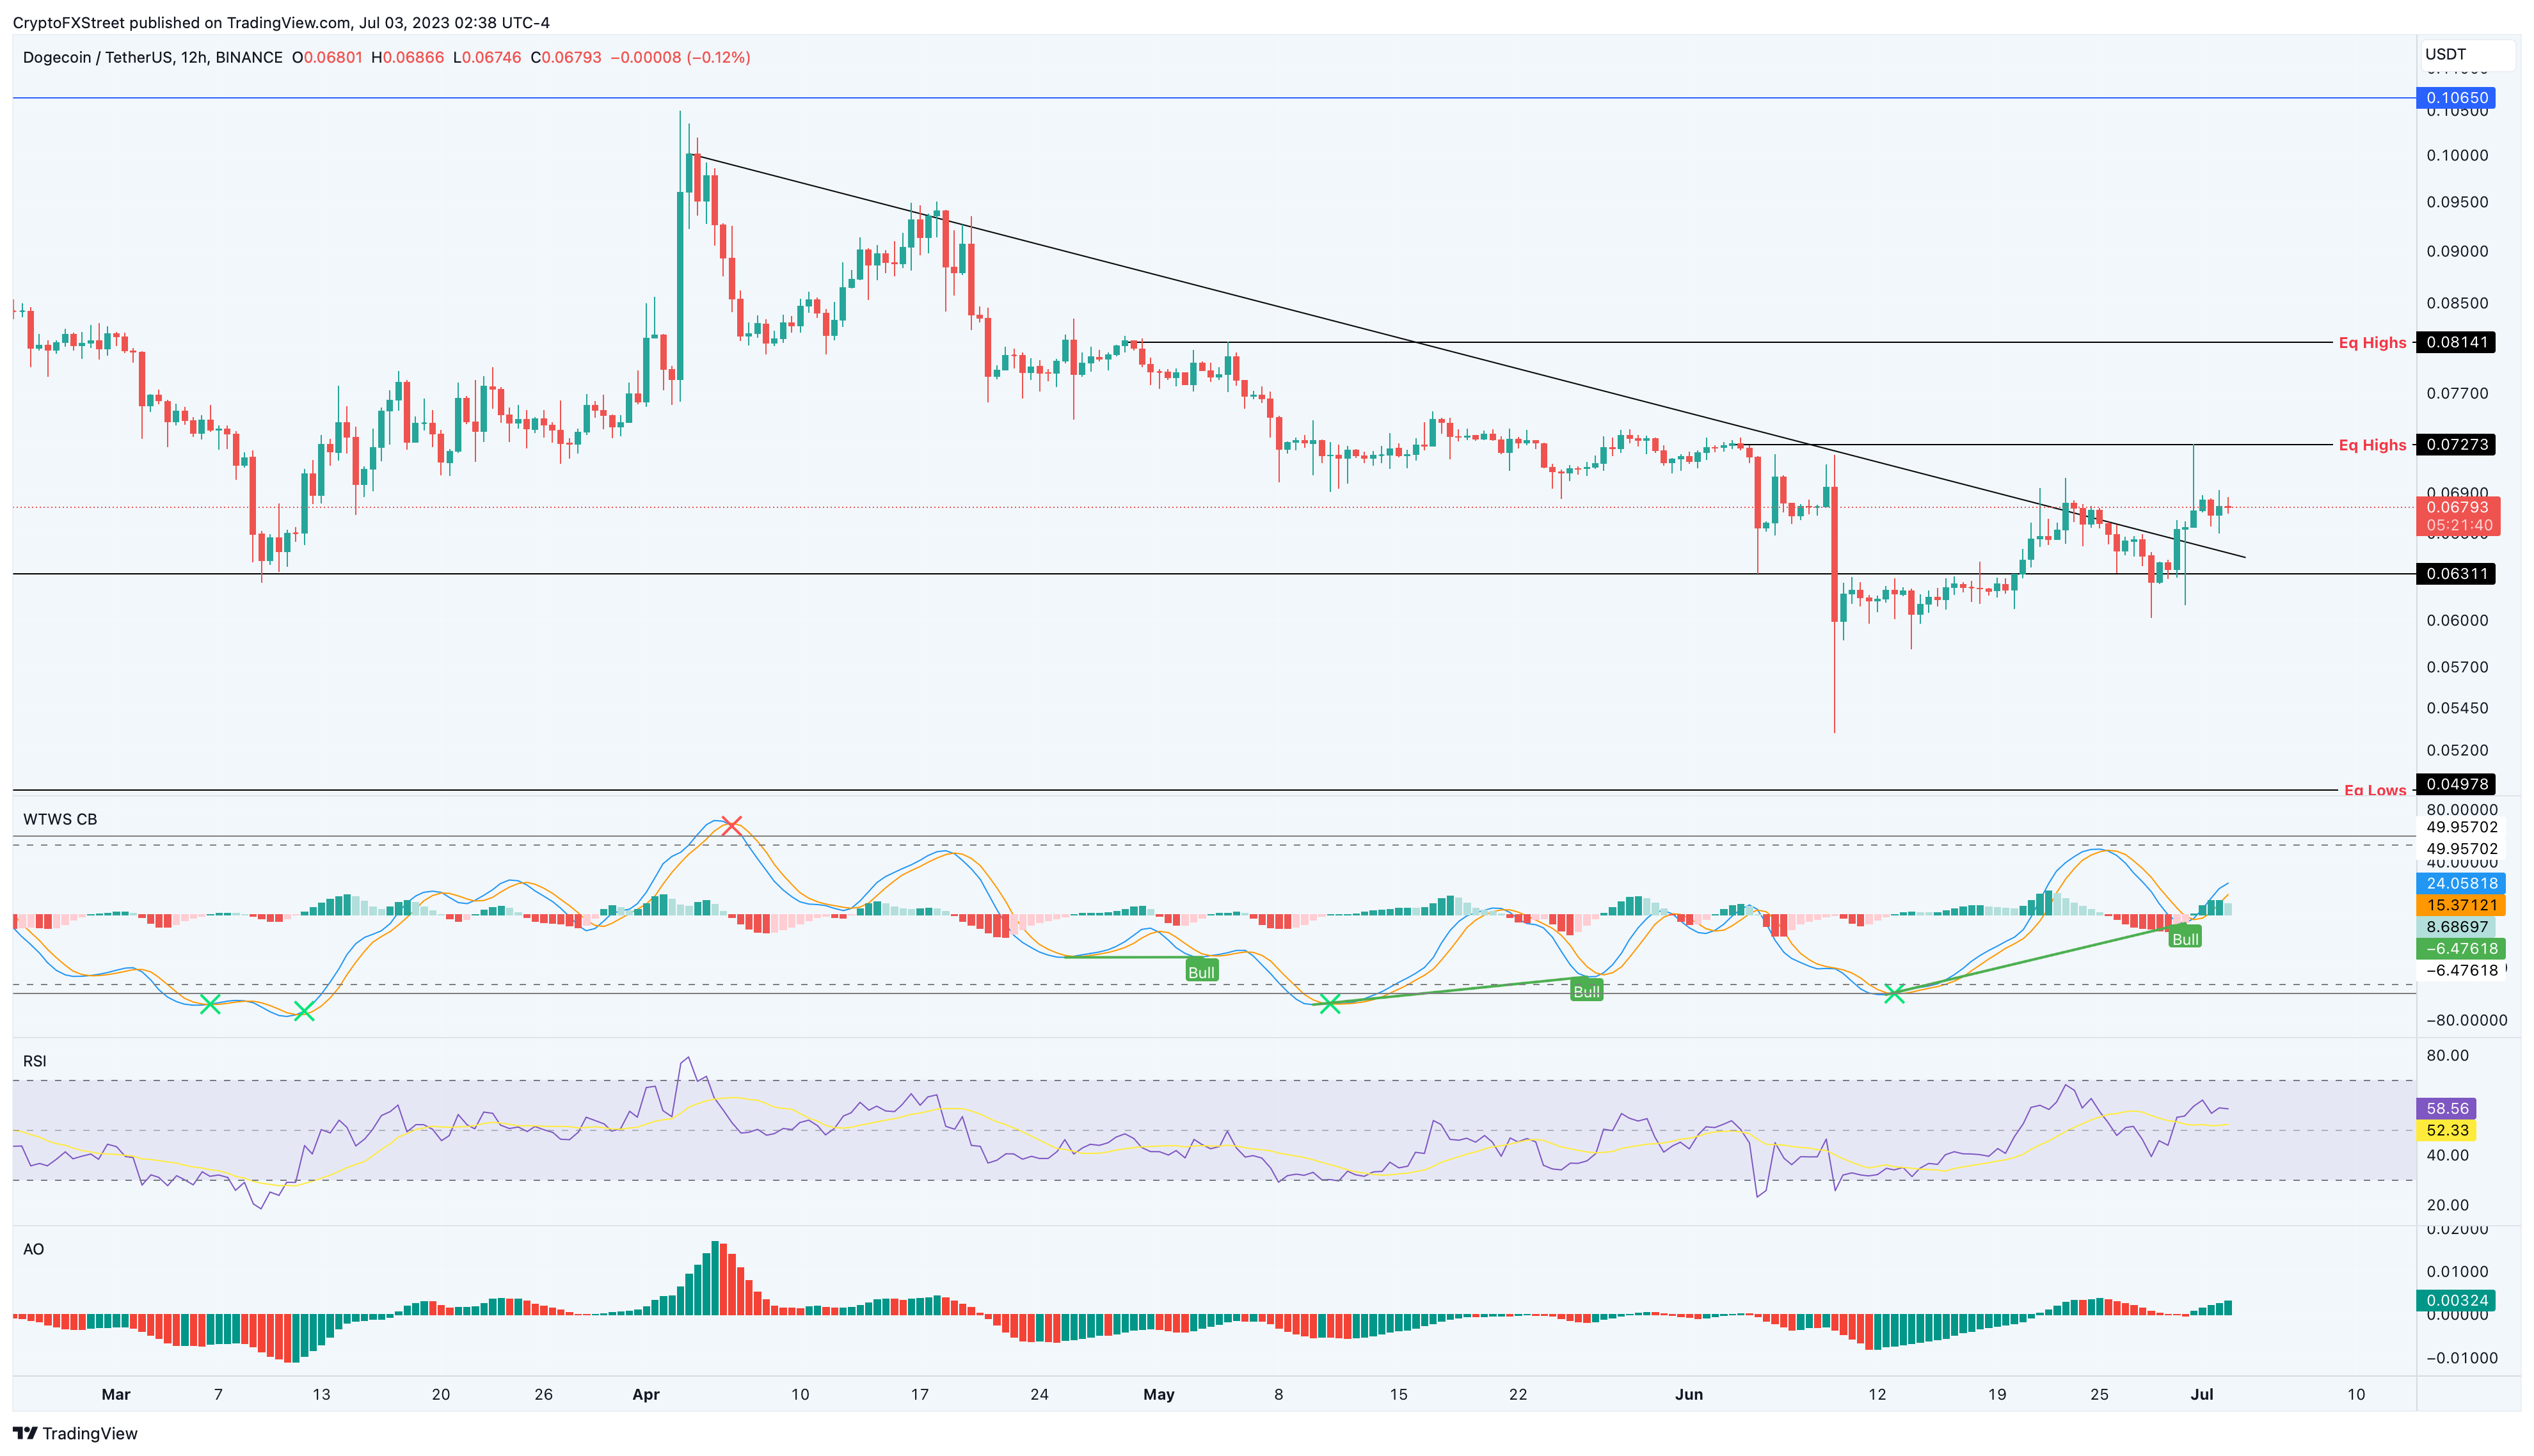
DOGE/USDT 12-hour chart
Furthermore, the three-day chart of Dogecoin (DOGE) price also shows a similar outlook. The Wave Trend indicator has flashed a bullish crossover for the first time in nearly a year. The last time this buy signal was spotted, DOGE rallied 118% in the following four months.
While the Wave Trend indicator flashes a buy signal, the RSI and the AO indicators on the three-day chart need to recover above their respective mean levels to add credence to the thesis. Still, a spike in buy pressure supported by Bitcoin price could see Dogecoin price tagging the $0.106 hurdle. This move would constitute a 56% gain from the current position at $0.0679.
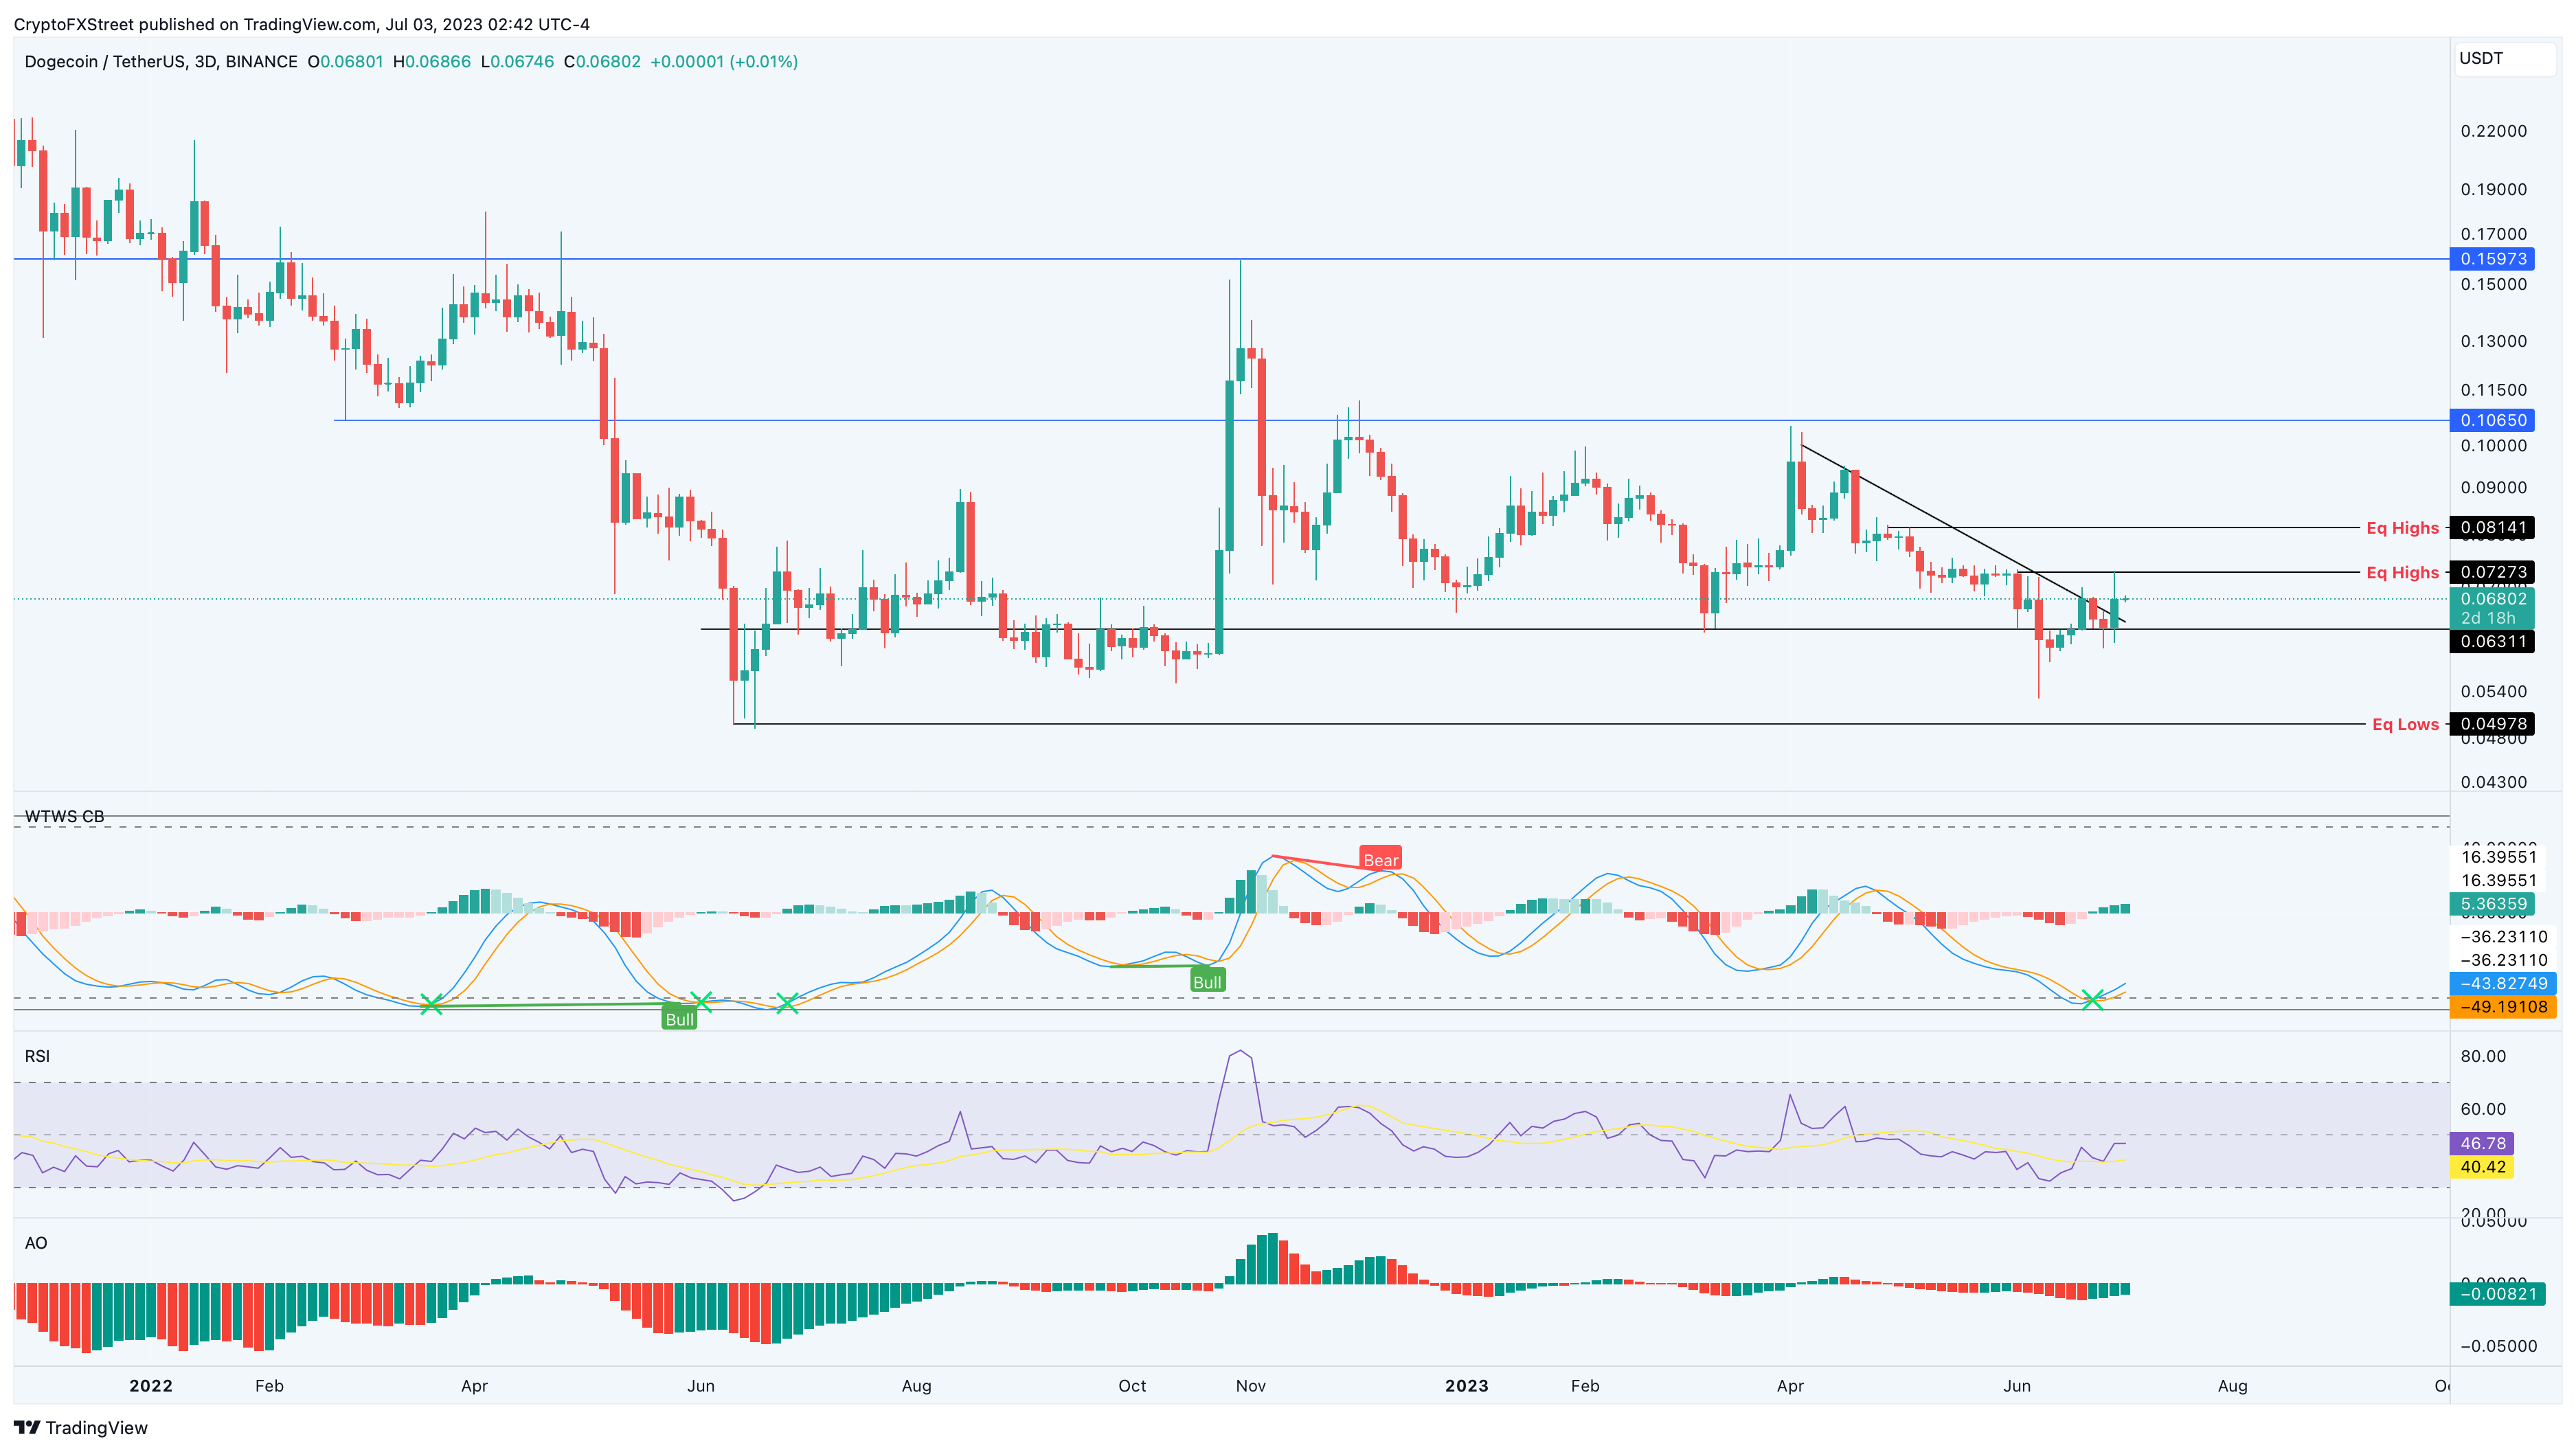
DOGE/USDT 3-day chart
On the other hand, if Dogecoin price produces a decisive flip of the $0.0631 hurdle into a support floor, it would invalidate the bullish thesis. Such a move would skew the odds in the bears’ favor and potentially trigger a 21% decline from this support to the next floor at $0.0497.
Like this article? Help us with some feedback by answering this survey:
Author

Akash Girimath
FXStreet
Akash Girimath is a Mechanical Engineer interested in the chaos of the financial markets. Trying to make sense of this convoluted yet fascinating space, he switched his engineering job to become a crypto reporter and analyst.


