Dogecoin Price Prediction: DOGE needs to slice through critical resistance to retest all-time highs at $0.088
- Dogecoin price breaks out of a symmetrical triangle consolidation due to buying pressure.
- The breakout was followed by Elon Musk's "Doge" tweet.
- Transaction history shows a large buyer concentration at $0.045 supporting the upswing.

Dogecoin price shows signs of life after retracing almost 75% from a record high of $0.088 fueled by the so-called Reddit Rebellion. As all eyes turned from the stock market drama to DOGE, the prices skyrocketed a whopping 800% in a few hours.
Dogecoin price heads to greener pastures
At the time of writing, DOGE seems to be resurrected from the dead due to Elon Musk's tweet. The meme token has already hit its target at $0.055 after surging by 82% following the breakout from a symmetrical triangle. If the buying pressure continues, Dogecoin price could slice through the next critical resistance level at $0.058.
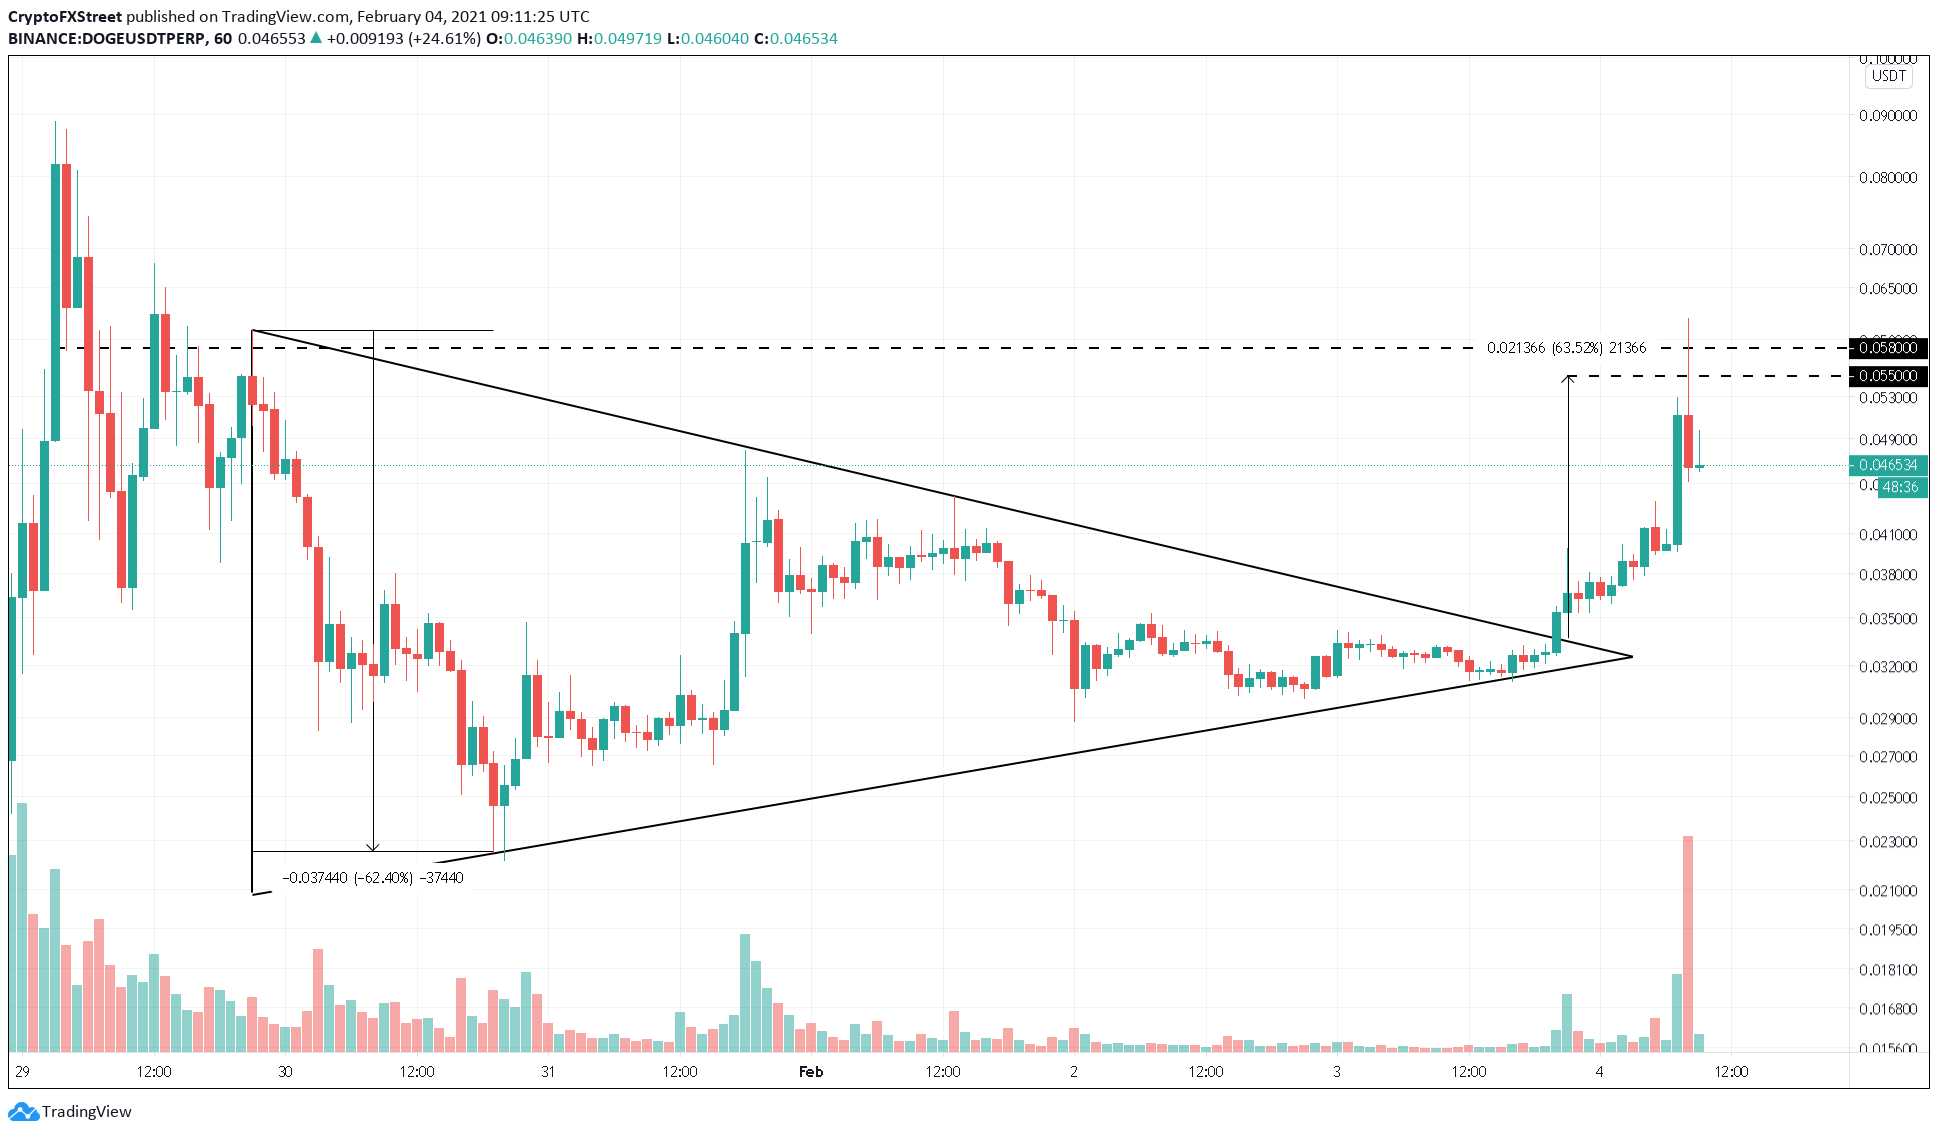
DOGE/USDT 1-hour chart
The IOMAP model by IntoTheBlock reveals subtle resistance up to the $0.057 level and can be overcome if the buy orders continue to pile up. However, a crucial supply barrier lies at $0.058 that could seriously hinder Dogecoin's rally.
Here, roughly 6,000 addresses had formerly bought nearly 675 million DOGE. Breaking above this zone could catapult the altcoin to retest its recent all-time high of $0.088 or even jump start a new rally to record highs.
Moreover, any short-term selling pressure is expected to be cushioned by the support level at $0.052. Here, 478 addresses previously purchased 572 million DOGE. Hence, if the price heads any lower, holders around this price range may buy tokens to keep their investment ‘In the Money.’
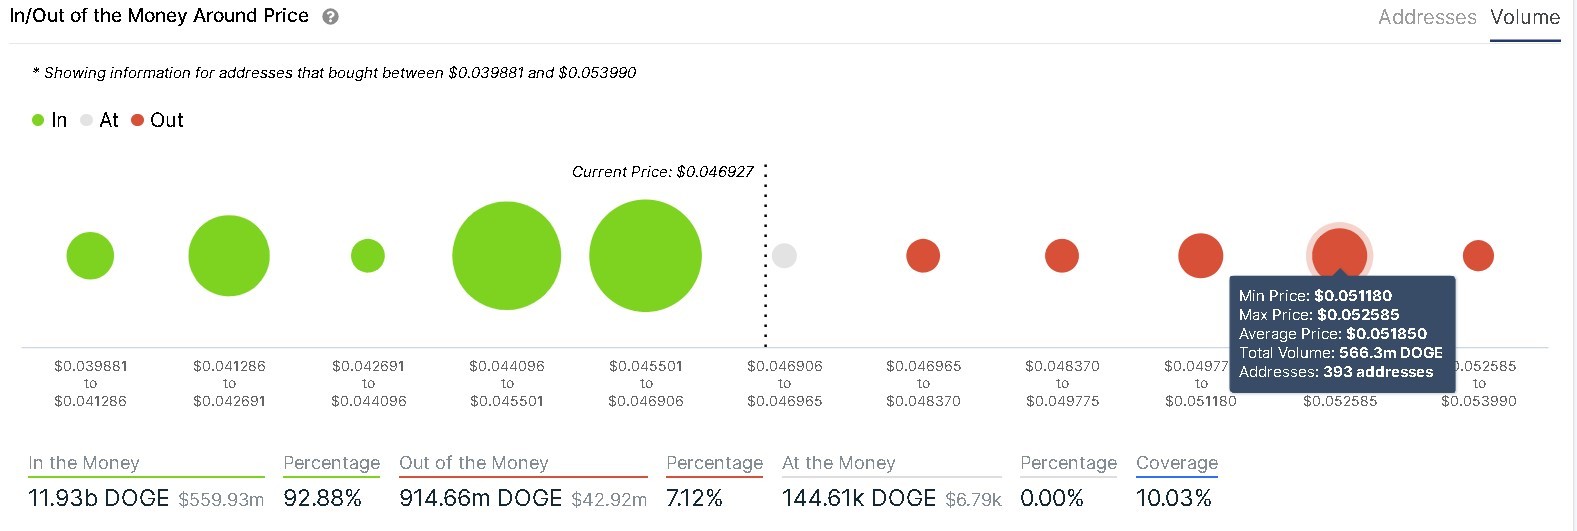
Dogecoin IOMAP chart
It is essential to realize that the resistance around the $0.058 level could continue to subdue the price as many investors who purchased Dogecoin here are ‘Out of the Money.’ Therefore, if the selling pressure intensifies and DOGE fails to hold above the support at $0.051, a downswing could occur, forcing the coin to revisit the next immediate support barrier at $0.050.
Author

Akash Girimath
FXStreet
Akash Girimath is a Mechanical Engineer interested in the chaos of the financial markets. Trying to make sense of this convoluted yet fascinating space, he switched his engineering job to become a crypto reporter and analyst.


