Dogecoin Price Prediction: DOGE down 4% but potential for a rally remains strong
- Dogecoin price is down 4% on February 1.
- The uptrend remains intact despite the sell-off, with bullish targets near $0.10.
- Invalidation of the bullish thesis would arise from a breach below $0.087.

Dogecoin price witnessed an influx of volatility in the last two days. Despite the recent sell-off, there are factors within the technical suggesting DOGE could rally higher.
Dogecoin price is still in an uptrend
DogeCoin price is currently at $0.092 , down 4% on the day, as traders have taken profit following Tuesday's 9% rally. Despite the profit-taking event, traders should continue to play the market on a trade-by-trade basis, as Dogecoin is known for pulling off stunning market reversals.
The 8-day exponential moving average (EMA) has been vital for Dogecoin's price action throughout the winter, as it rallied by nearly 40% since January 1. Currently, the 21-day simple moving average (SMA) is 5% below the current market value. A closing candlestick beneath this indicator could signal the end of the uptrend.
The Relative Strength Index (RSI) is an indicator used to assess trend tops and bottoms by comparing and contrasting previous rallies. The January 31 surge marked a new high on the RSI, which resets the bearish divergences displayed throughout the uptrend. This subtle gesture of bullish strength should be considered moving forward.
It is worth noting that the RSI is currently printing a hidden bullish signal as it comes back to retest support. Considering these factors, Dogecoin price can rally once more, with a target at the psychological $0.10 liquidity zone. This scenario would create the potential for a 10% rise from Dogecoin's current price.
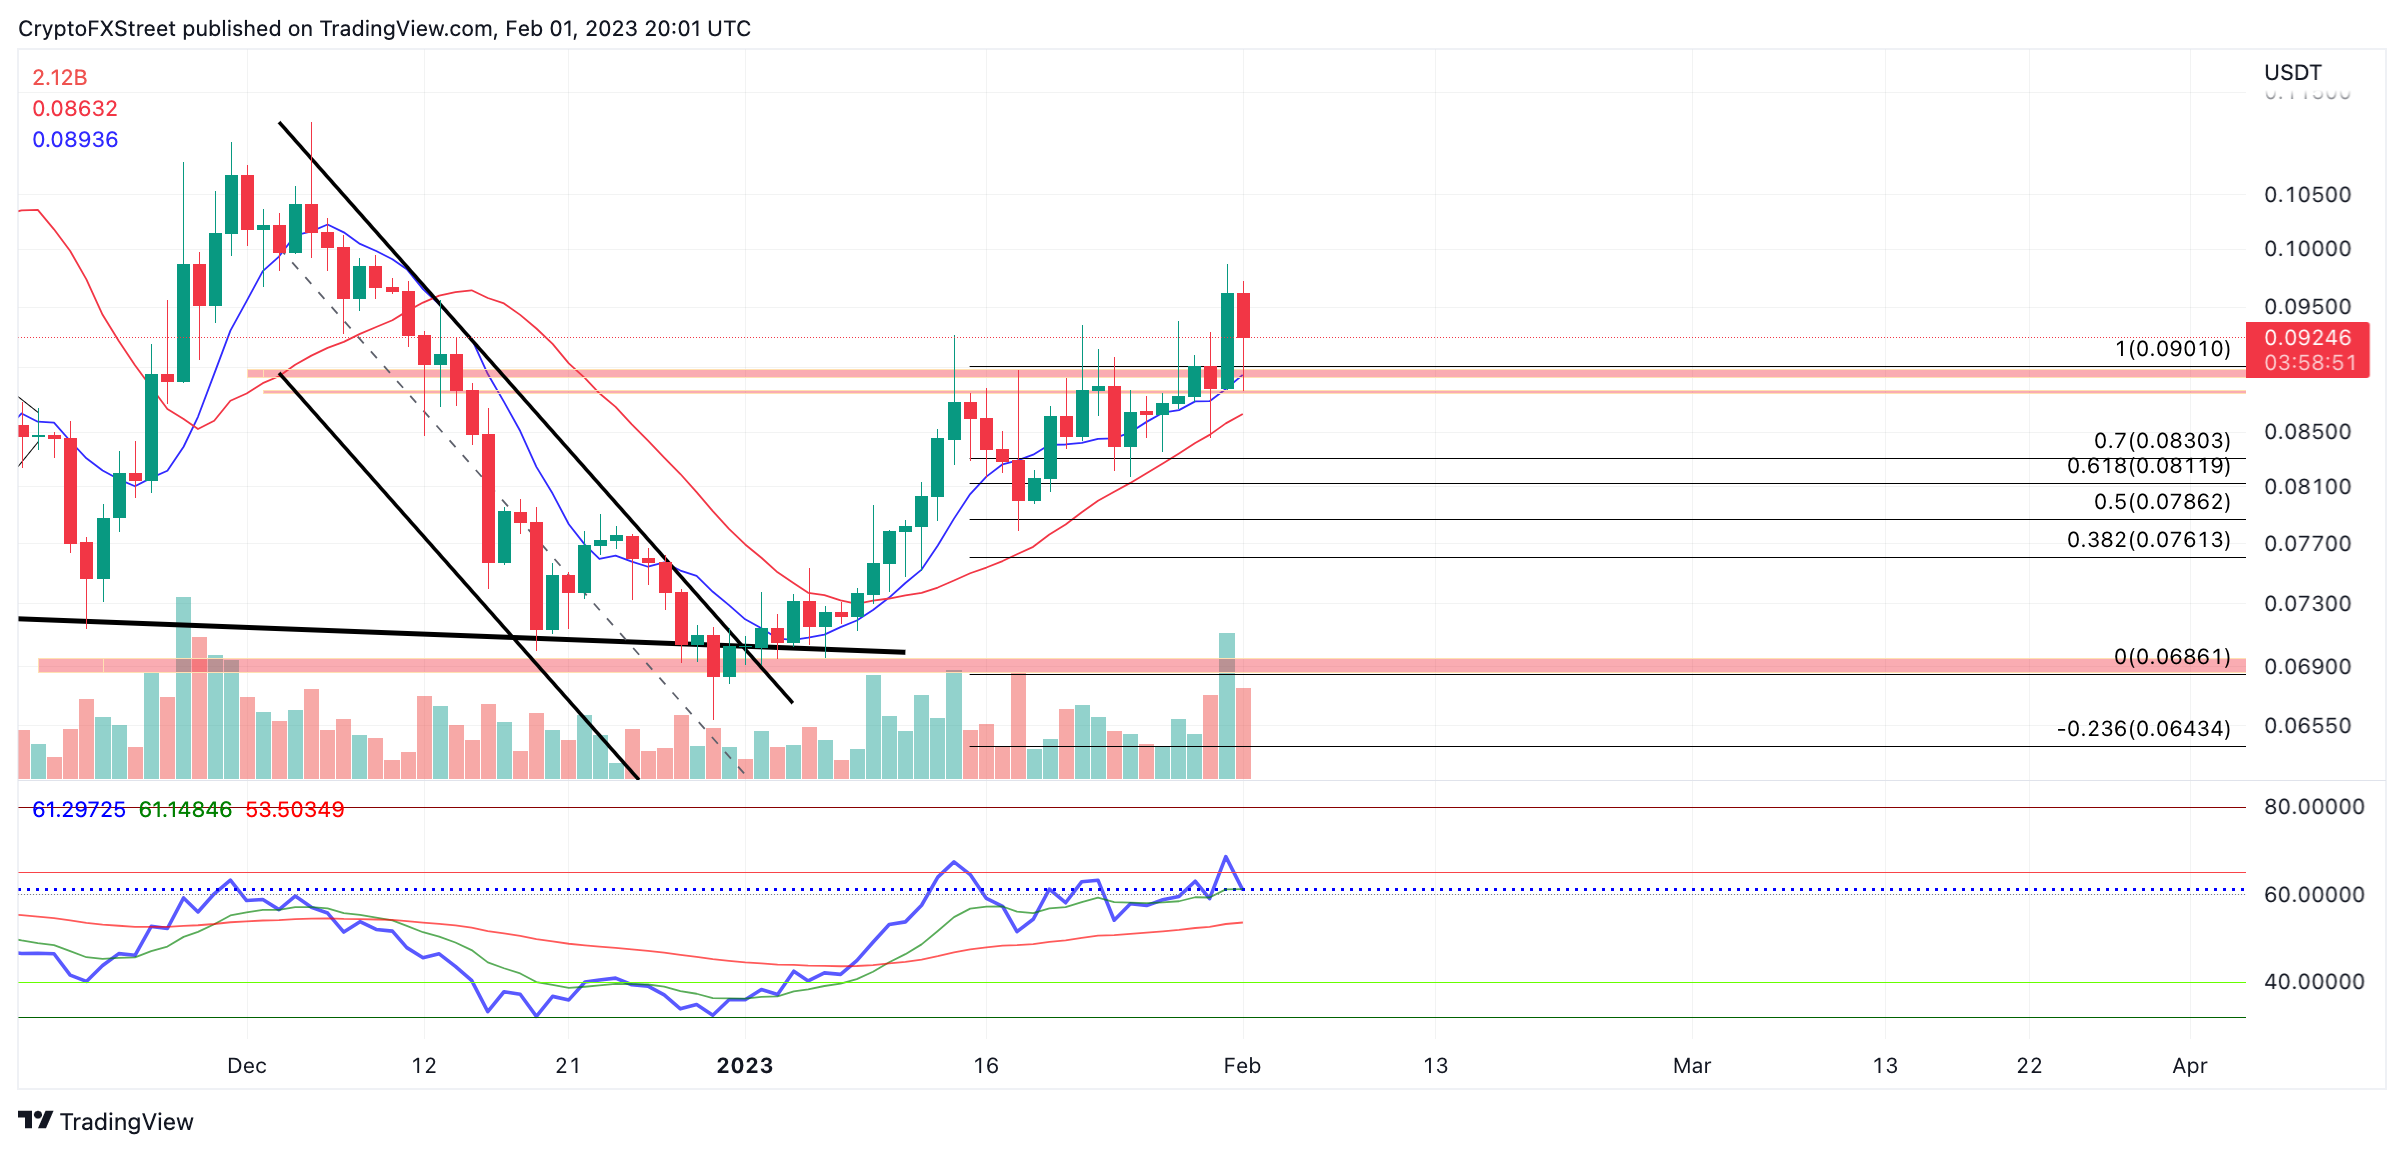
DOGE/USDT 1-day chart
However, if the bears produce a closing candlestick beneath the 21-day simple moving average, currently marked at $0.087, the uptrend thesis could be invalidated. In this scenario, the bears could promote a steeper decline targeting the halfway point of the 40% rally near $0.07. Dogecoin price could decline by up to 17% if the bears were to succeed.
Author

Tony M.
FXStreet Contributor
Tony Montpeirous began investing in cryptocurrencies in 2017. His trading style incorporates Elliot Wave, Auction Market Theory, Fibonacci and price action as the cornerstone of his technical analysis.


