Dogecoin price may fall 40% as fragile DOGE fundamentals multiply
- Dogecoin price fails to hold 50-day simple moving average (SMA), starting a new drift lower.
- Daily active addresses break below the multi-year trend line, confirming waning interest in the meme token.
- DOGE has been underperforming BTC since the beginning of June, showing a lack of relative strength amidst the uncertainity.

Dogecoin price has shifted from a wide descending channel to a tighter channel after support folded at the 50-day SMA. The underperformance with Bitcoin and the breakdown in daily active addresses indicate a challenging outlook for the short-term, particularly in a rudder-less cryptocurrency complex.
Dogecoin price outlook is inconclusive without the catalysts of FOMO
Dogecoin price looked primed for a new rally to the all-time high on June 4 after consecutive days of double-digit returns that propped DOGE on top of the rising 50-day SMA. It ended a multi-week descending channel that was briefly penetrated to the downside on May 19.
Like most of May, Dogecoin price slipped under the weight of an uncertain environment in the broader market and has now formed a new, albeit tighter, descending channel marked by low volume. DOGE failed to break out from the channel yesterday on the surge in Bitcoin price, finishing with just a 5% gain.
Dogecoin price has not shown a rush for the exits similar to other cryptocurrencies, but it also has not generated a rally of more than three days since the May 8 high. It is clear that investors are slowly pulling away from the digital asset.
A daily close below the May 29 low of $0.276 would raise the probability that Dogecoin price will test the May 23 low of $0.246 and the May 19 low of $0.195, provoking a 40% decline.
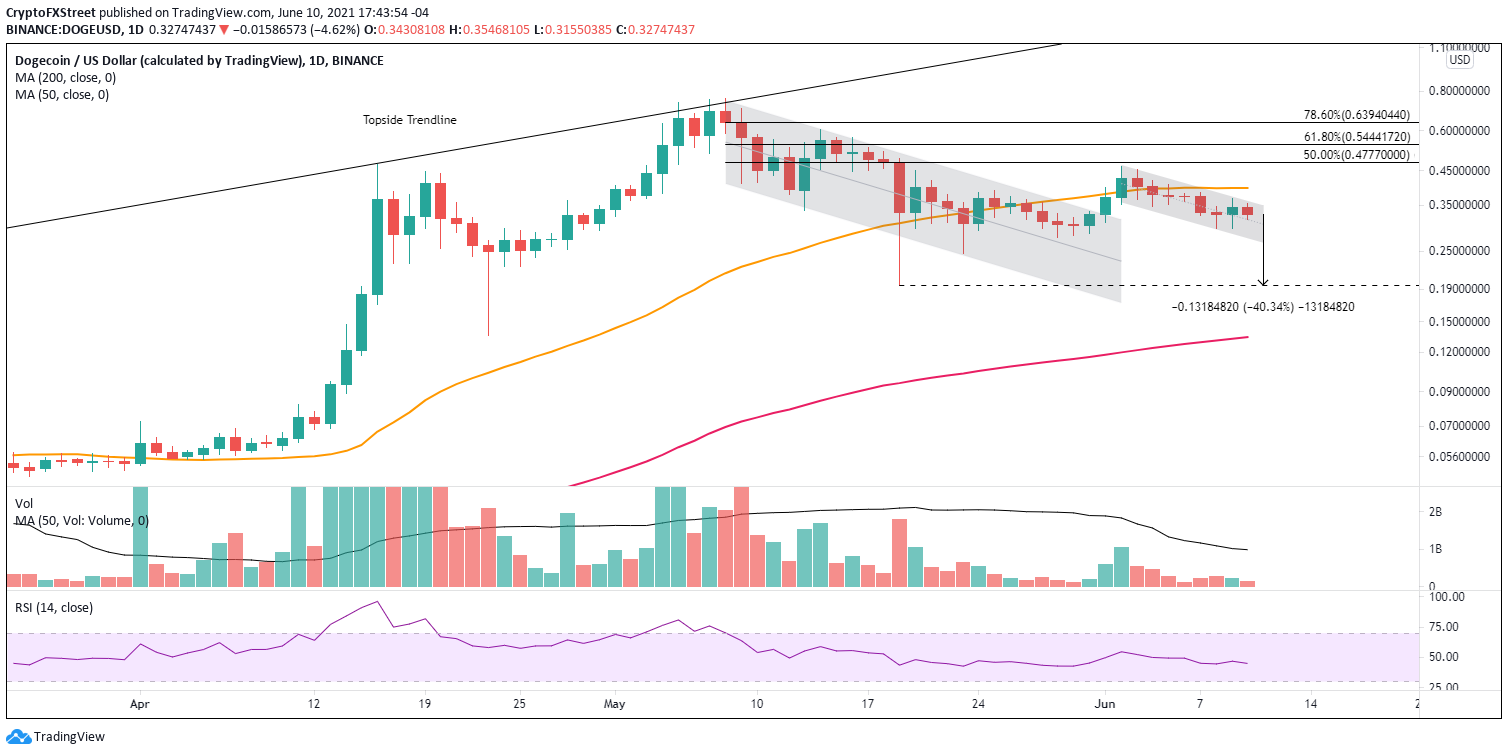
DOGE/USD daily chart
Until there is a daily close above the 50-day SMA at $0.396, to confirm a break from the descending channel, Dogecoin price may remain in the same quiet descent moving forward.
Confirming the unremarkable but subtle underperformance of Dogecoin price is the DOGE/BTC pair chart. Since the beginning of May, the pair has been constructing a symmetrical triangle with the most recent leg aiming down, indicating DOGE underperformance due to a preference for the bellwether cryptocurrency in a period of market uncertainty. Bullish DOGE investors want to see relative strength against the larger cryptocurrencies.
It is essential to mention that the pair is near the intersection of the triangle’s lower trend line with the 50-day SMA. A full breakdown of Dogecoin price could be just around the corner.
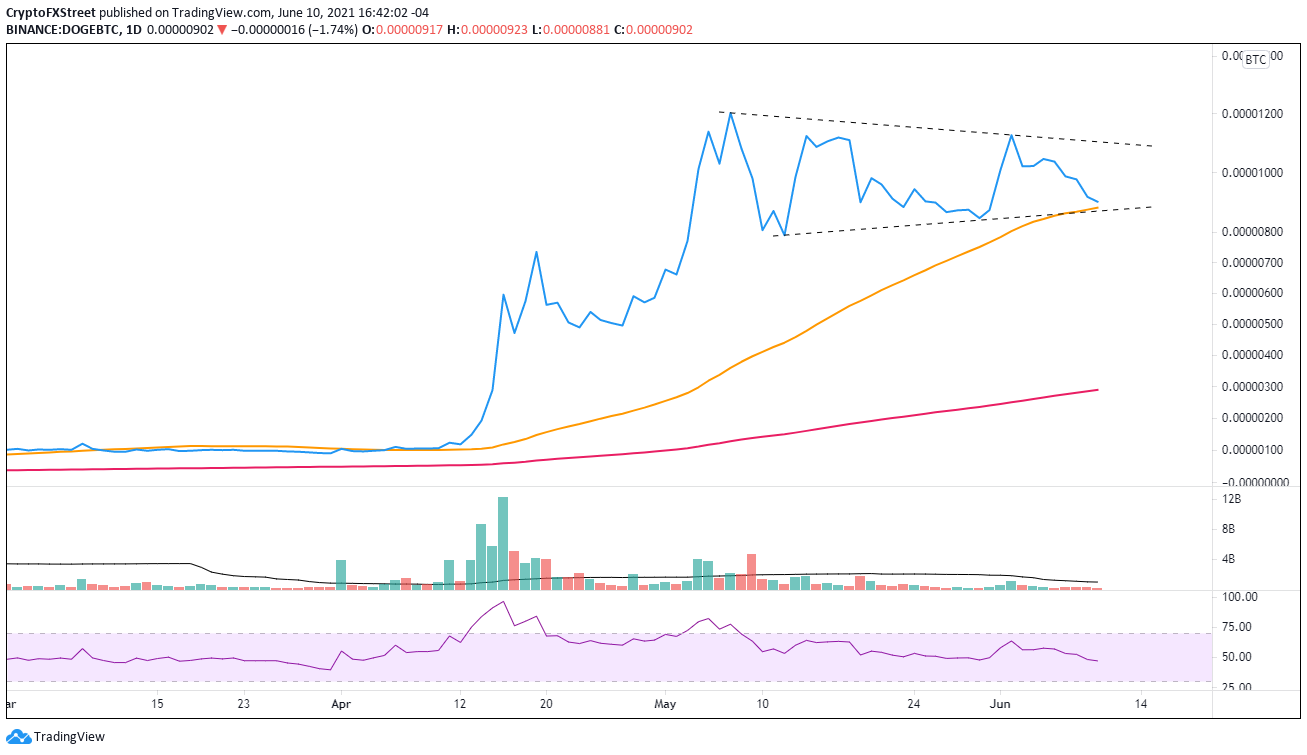
DOGE/BTC daily chart
Over the last month, a second bearish development is the breakdown of the multi-year uptrend in Daily Active Addresses (DAA). The current level of active addresses is the lowest since June 2020.
With the steady rise in DOGE address interaction broken, the decline in prices has whittled away the interest in the cryptocurrency and removes a base of price support moving forward.
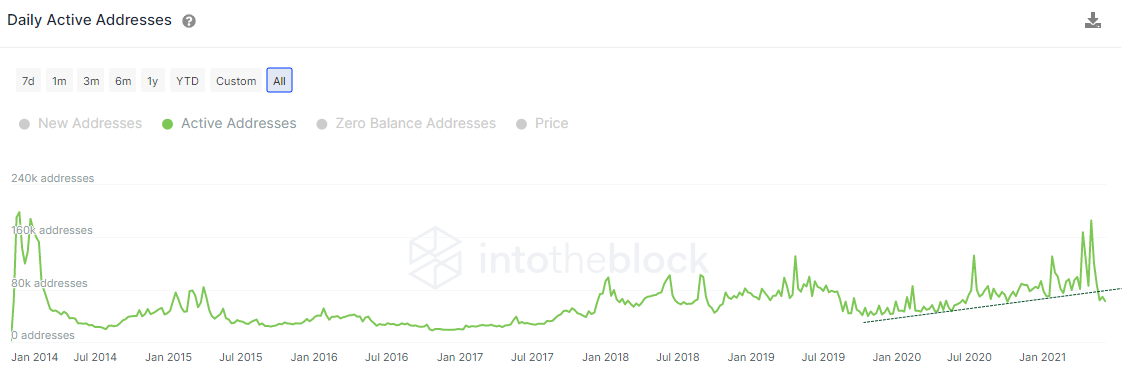
DOGE Daily Active Addresses (DAA)
Dogecoin price is not on the cusp of a significant rally. Instead, DOGE may be on the edge of another plunge as underperformance and less interest in the token may prevent it from withstanding any further market weakness.
Author

Sheldon McIntyre, CMT
Independent Analyst
Sheldon has 24 years of investment experience holding various positions in companies based in the United States and Chile. His core competencies include BRIC and G-10 equity markets, swing and position trading and technical analysis.



