Dogecoin price consolidation could result in a downswing to $0.23
- Dogecoin price has suffered a reversal since June 2.
- DOGE appears to be trading within upper and lower trend lines of an ascending parallel channel.
- While the meme coin has been able to find outstanding support, the prevailing direction for the asset is sideways in the short term.

Dogecoin price has slumped lower in the past few days, reaching $0.31. Although DOGE is still up by over 55% from its low amid the market crash recorded on May 19, the meme coin has failed to find strength.
Dogecoin price heads lower as bulls lose strength
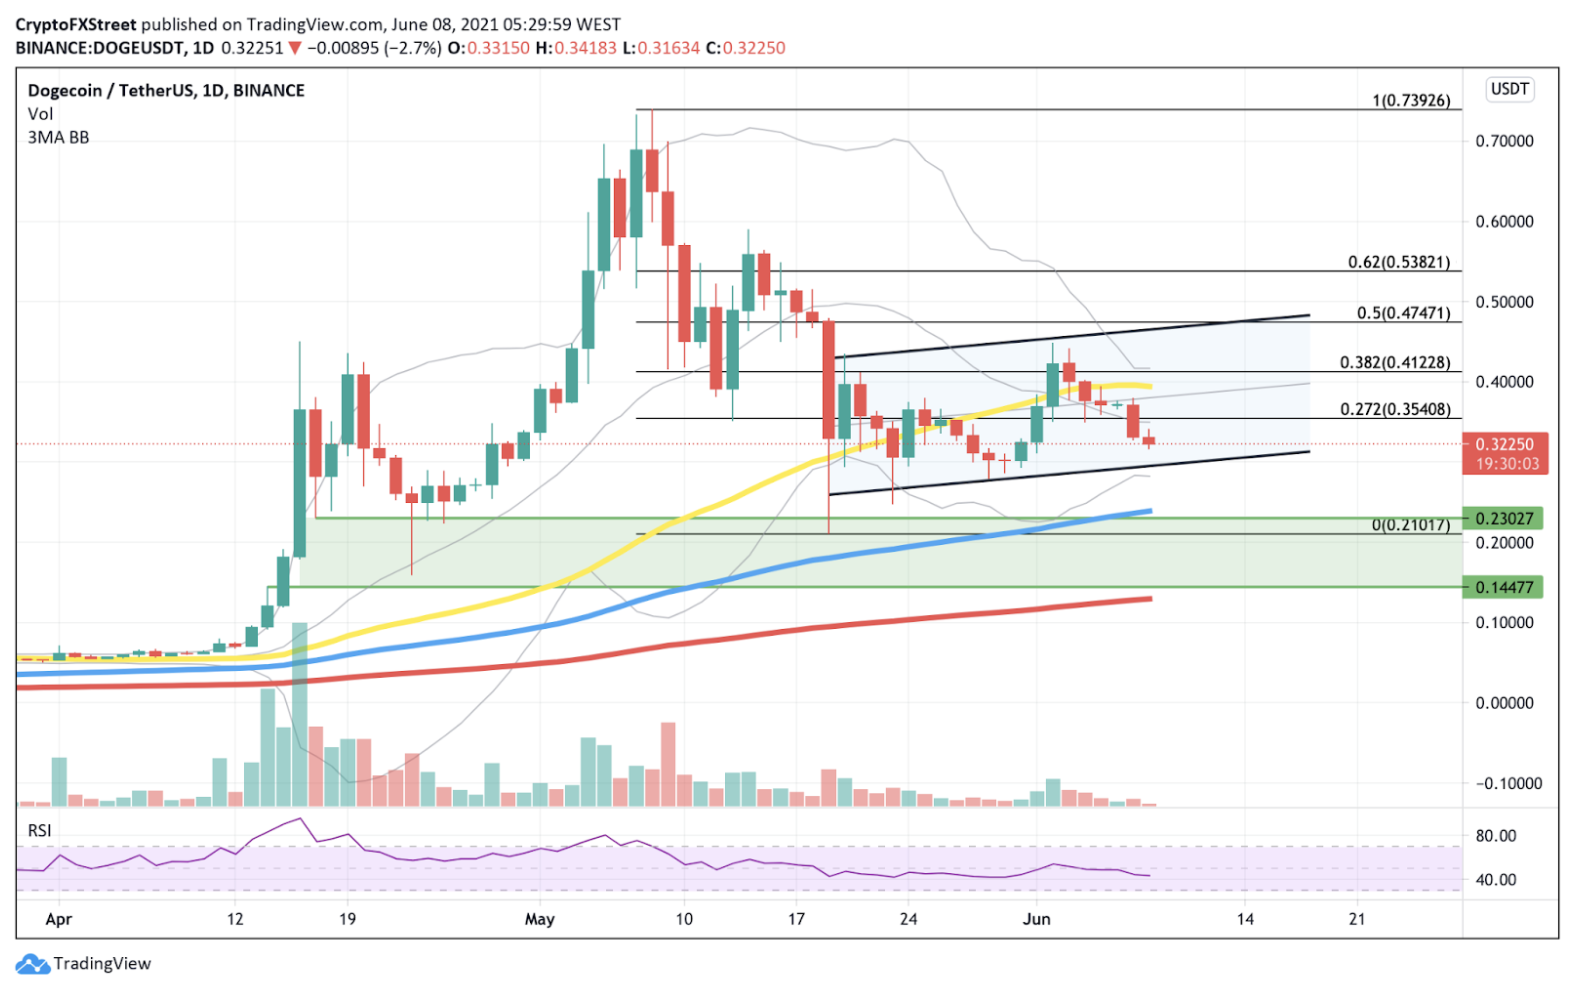
Dogecoin price is currently down by over 55% from its all-time high of $0.73, failing to recover. On the daily chart, DOGE appears to be trading sideways, forming an ascending parallel channel.
By connecting the continuous higher lows and the slightly higher highs, two trend lines have been formed to create the chart pattern. Dogecoin price is stuck within the inner boundaries of the two trend lines, suggesting that the sideways trend could continue.
While the prevailing trend of the chart pattern is sideways in the short term, it should be noted that yesterday’s candlestick showed that it was a bearish engulfing day, which could raise concern for DOGE.
Speculators should also turn their attention to the Dogecoin 50-day moving average, which adds credence to the bearish outlook as DOGE lost the strength to hold the area as support and subsequently fell below the critical level at $0.39.
DOGE/USDt 1-day chart
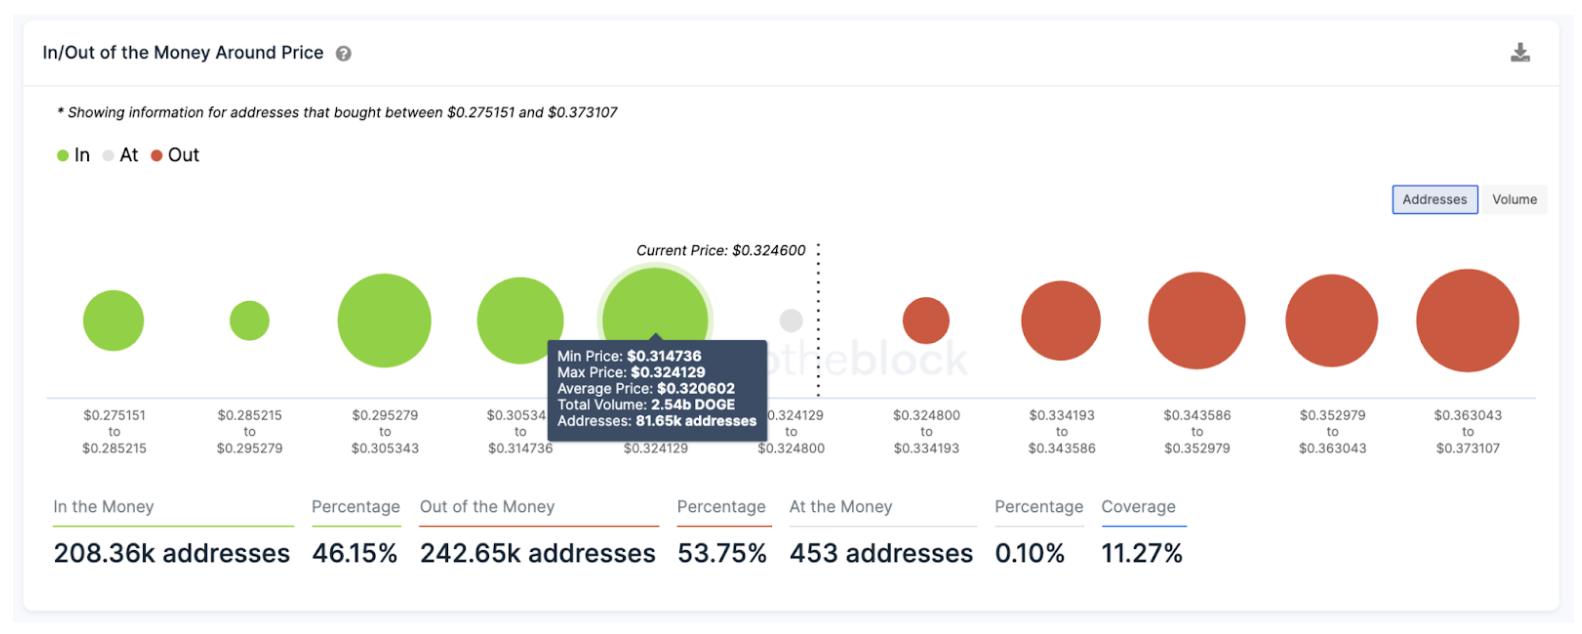
The lower trend line of the parallel channel could act as the direct line of defense for Dogecoin, at $0.30. IntoTheBlock’s In/Out of the Money Around Price (IOMAP) also shows that additional support may be found just beneath the current price, where a total of over 81,650 addresses bought over 2.54 billion DOGE at an average price of $0.32.
Even though lower lows seem unlikely, a breach of the $0.29 support could see Dogecoin price plummet towards the demand zone ranging from $0.23 to $0.14.
DOGE IOMAP
Despite the sideways price action, there is still hope for DOGE bulls, as the ascending parallel channel indicates that Dogecoin could continue making higher highs and higher lows.
Investors should also turn their attention to the Bollinger bands squeeze seen in the price trend, which is indicative of periods of low volatility that are usually succeeded by high volatility. A spike in buying pressure could ignite strength in DOGE, pushing Dogecoin price to break out above the topside trend line of the parallel channel, tagging the 62% Fibonacci extension level at $0.54.
Author

Sarah Tran
Independent Analyst
Sarah has closely followed the growth of blockchain technology and its adoption since 2016.



