Dogecoin Price Forecast: DOGE to retest critical support before overcoming doubt
- Dogecoin price thrilled investors after posting a 17% surge on July 26.
- Following the swing high, DOGE has wiped out most of those gains as it retraces.
- Essential levels of support are expected to be retested before Dogecoin price reveals its next move.

Dogecoin price has formed an uptrend since July 21, breaking out from a downward trapped DOGE for nearly a month. The canine-themed cryptocurrency recorded a swing high at $0.23, however, it is expected to retrace and test crucial levels of support before revealing directional intentions.
Dogecoin price stuck between two significant levels
Dogecoin price has been sealed in a descending parallel channel on the daily chart that emerged on June 27 and continued to confine DOGE until July, when it finally closed above the upper boundary of the chart pattern.
Another parallel channel was drawn above the current technical pattern to give Dogecoin price a measured target. DOGE exceeded expectations as it briefly traded 6% above the topside trend line of the channel, before failing to close above it as well as the 38.2% Fibonacci extension level at $0.20.
Dogecoin price appears to be enduring a retracement that usually follows a swing high, and could be due to retest critical support areas. DOGE appears to be stuck within the 38.2% Fibonacci extension level and the 23.6% Fibonacci level at $0.19, which acts as the first line of defense.
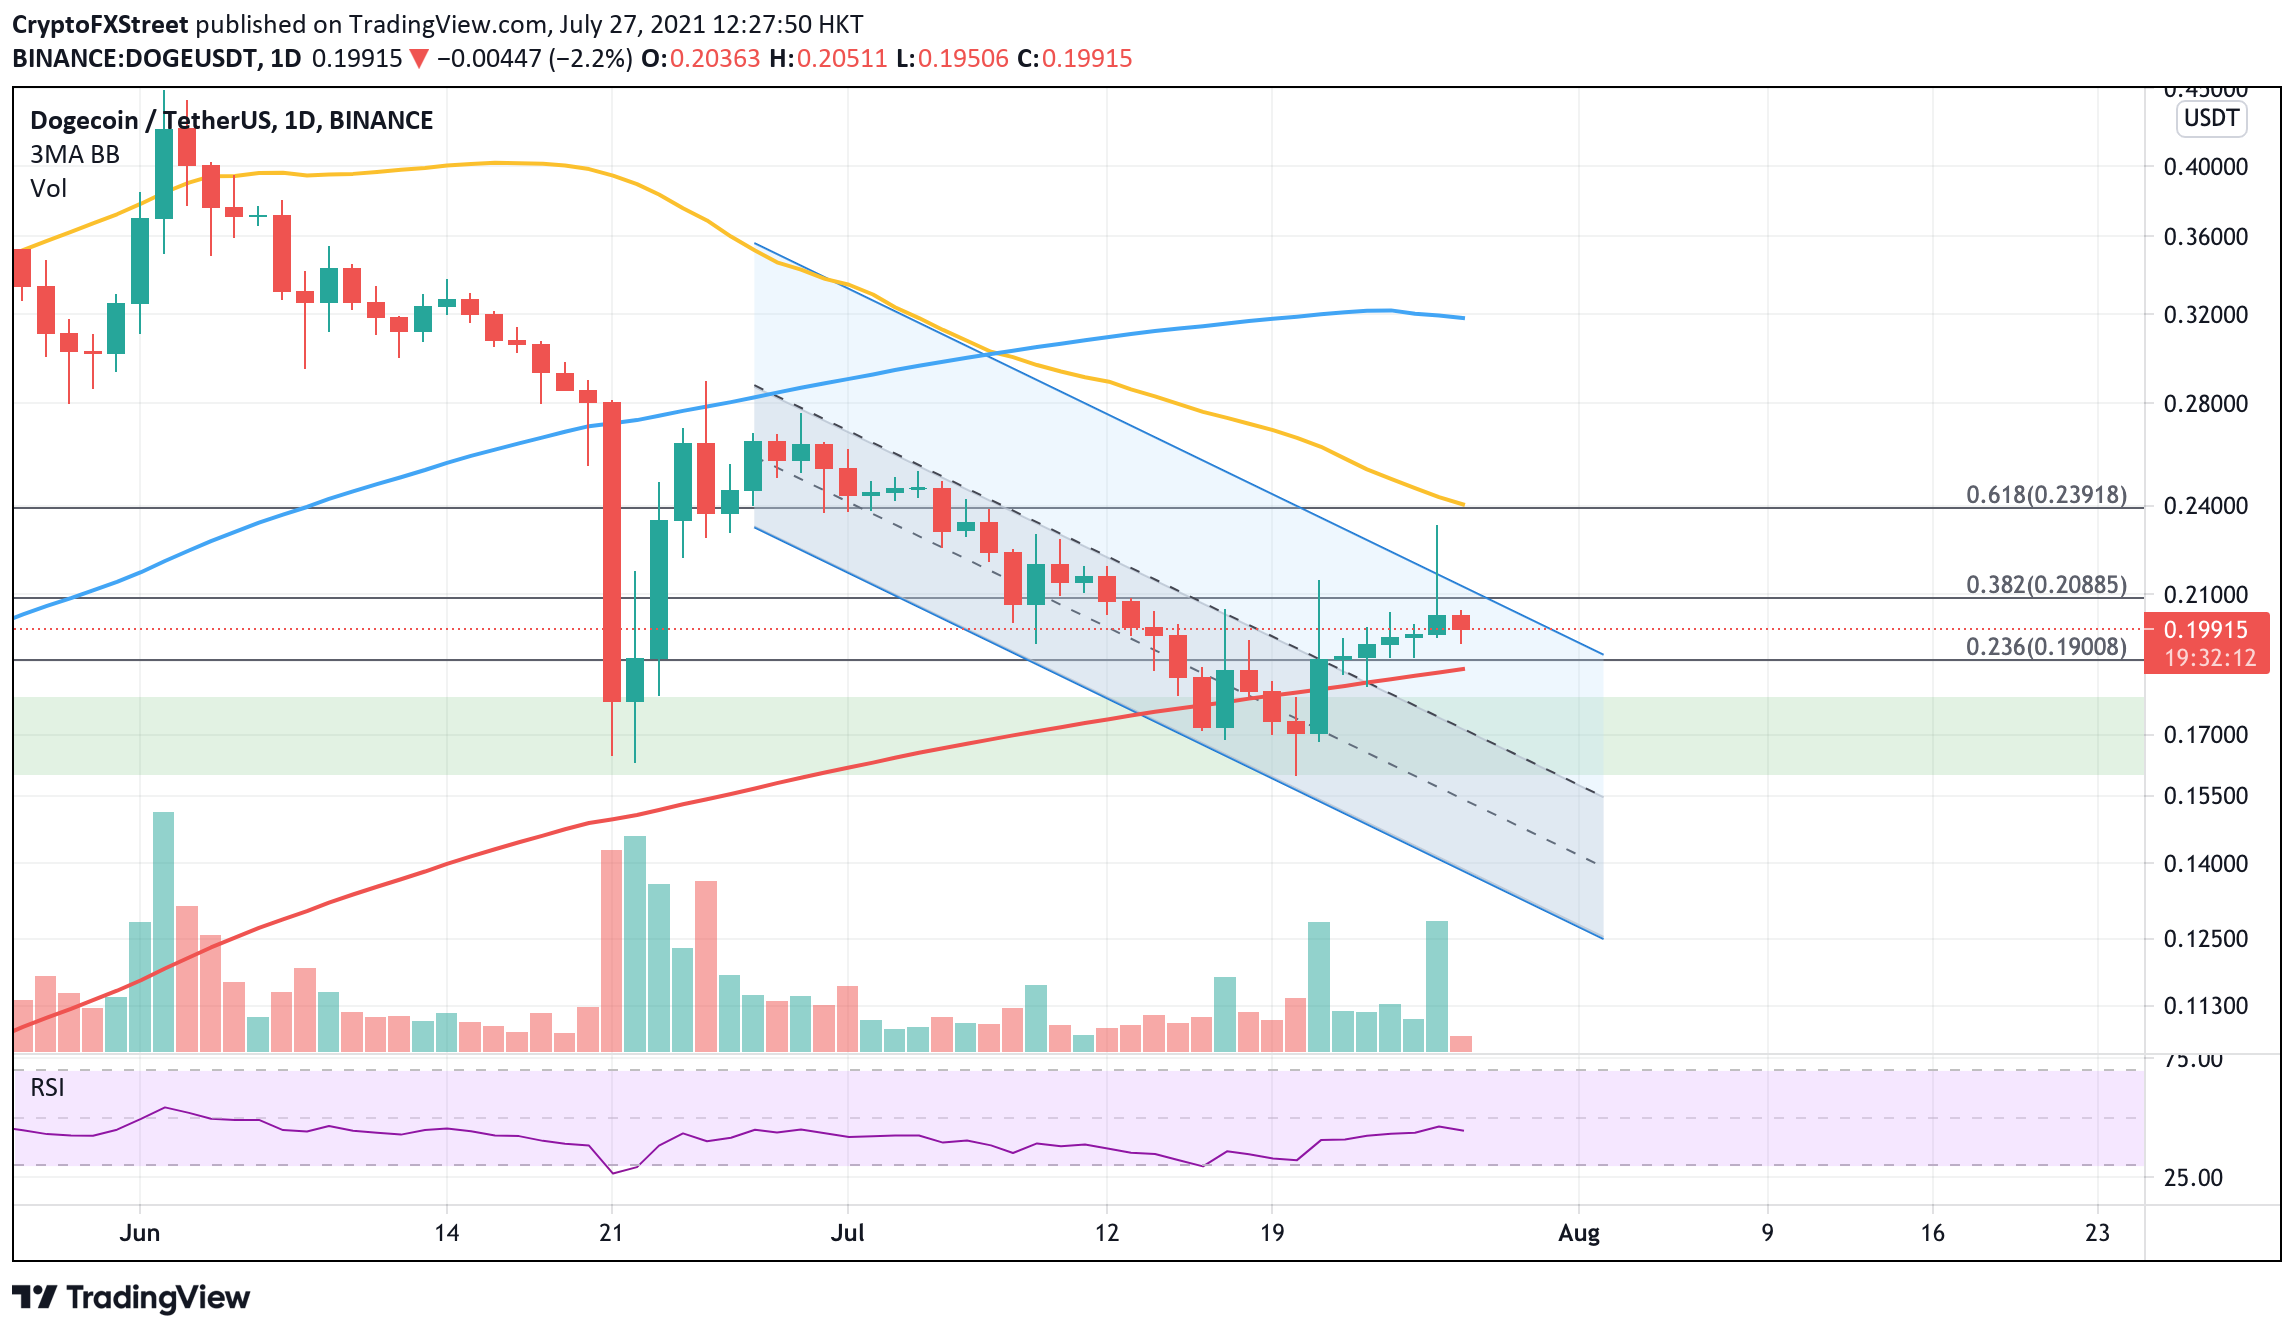
DOGE/USDT daily chart
Adding credence to the meaningful support is the 200-day Simple Moving Average (SMA), which is nearing $0.19. DOGE could be expected to reexamine its support before showing clearer indications of future price moves.
Although Dogecoin price is witnessing a slight retracement from its swing high, the aforementioned lines of defense should act as strong support for DOGE. However, if selling pressure were to see a spike, the coin could fall within the demand barrier, which extends from $0.16 to $0.18.
Dogecoin price would open up the possibility of further gains should DOGE be able to close above the 23.6% Fibonacci extension level at $0.19.
Adding credence to the bullish thesis is the Relative Strength Index (RSI), which suggests that the canine-themed cryptocurrency was not facing overbought conditions at the swing high on July 26, further indicating that Dogecoin price has room for more upside potential.
Investors should wait for a clear indication of higher volume to indicate accelerated interest and buying pressure before the bullish theory can be confirmed.
Author

Sarah Tran
Independent Analyst
Sarah has closely followed the growth of blockchain technology and its adoption since 2016.



