Dogecoin Price Forecast: A short-term 60% breakout play and macro levels to DCA
- Dogecoin price shows an explosive launch at the start of its 60% journey.
- While the short-term play for DOGE is bullish, investors should consider the ramifications from a big-picture perspective.
- A daily candlestick close below the $0.0471 support level could trigger a brutal sell-off for the meme coin.

Dogecoin price shows that the bulls are back in town and have already triggered a journey to the upside. While this outlook was expected in our previous publications, this article will also take a look into the macro outlook for DOGE.
Dogecoin price and the short-term outlook
Dogecoin price was primed for a 60% ascent after it breached the volume point of control, or level of greatest traded volume, at $0.0665 on August 4. Secondary confirmation came after DOGE penetrated above a key declining trend line on August 7.
As a result, Dogecoin price has rallied 7% so far and shows signs of continuing this trend to $0.110 - the midpoint of the $0.0497 to $0.170 range. However, to reach this short-term target, DOGE needs to clear the intermediate resistance level at $0.0776. Although clearing this hurdle would ease its journey, it does not guarantee it.
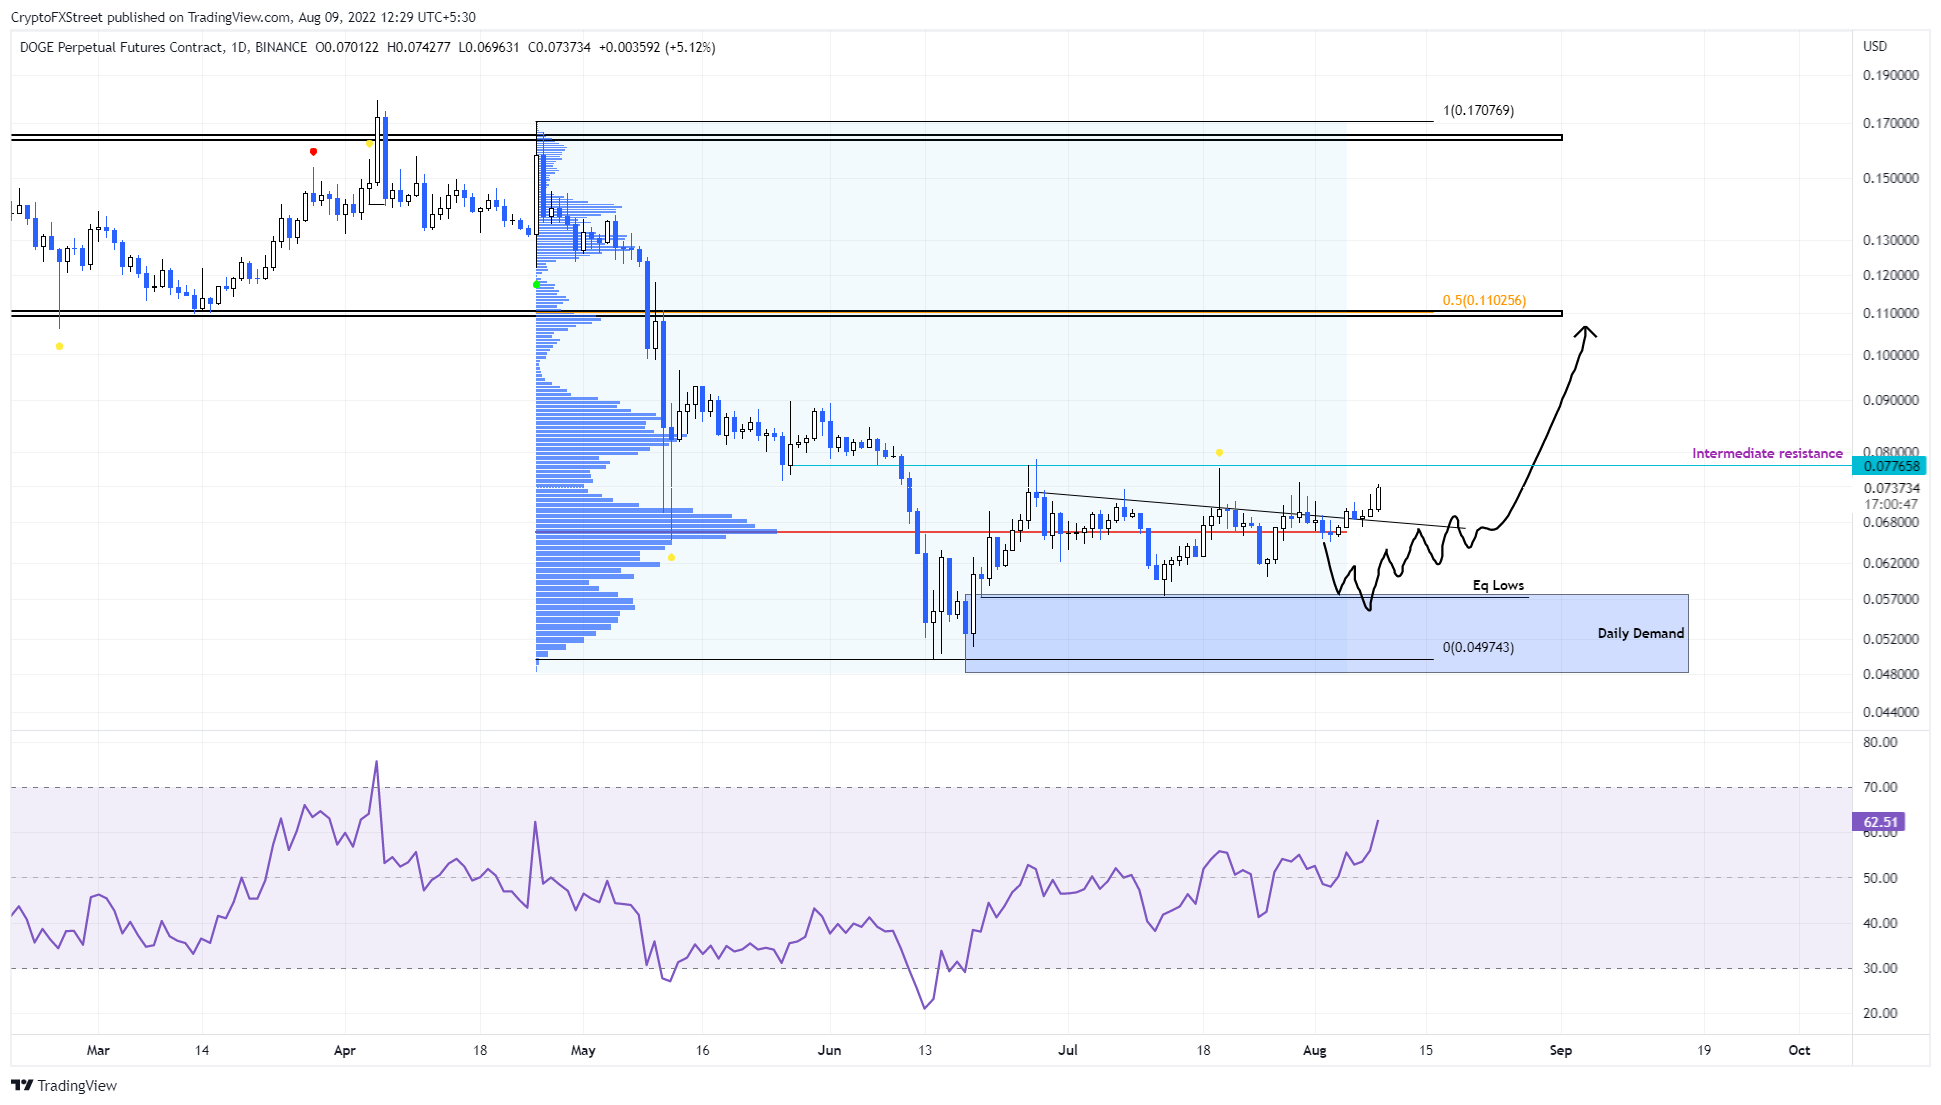
DOGE/USDT 1-day chart
This development for Dogecoin price will fail if the volume point of control at $0.0665 turns into resistance. One reason this might happen is if traders push the market down to seek out and collect the liquidity resting below the equal lows at $0.0573.
Even if Dogecoin price retreats, the presence of liquidity inside the $0.0480 to $0.0577 demand zone, is likely to make this level into a launching pad for bulls and a good buy opportunity for short-term traders.
Forewarning on DOGE’s macro outlook
While the short-to-mid-term outlook of Dogecoin price looks bright, a breakdown of the $0.0417 support level will indicate an infestation of bears and trigger a massive sell-off. Adding credence to this outlook is the fair value gap, aka price inefficiency zone extending from $0.0413 to $0.0140. These areas are formed when an asset moves quickly away from a particular direction. Such a move would involve a 70% drop from the $0.0417 support level.
The area between the two FVGs spanning from $0.0417 to $0.0098 could serve as a potential macro bottom, but investors should consider the possibility of a sell-off ‘wick’ reaching as low as $0.0050 due to the presence of another inefficiency.
These levels could serve as good levels for Dollar-Cost Averaging (DCA), the practice of investing the same amount of money in target security at regular intervals over a certain period of time, regardless of price, in order to deal with market uncertainty.
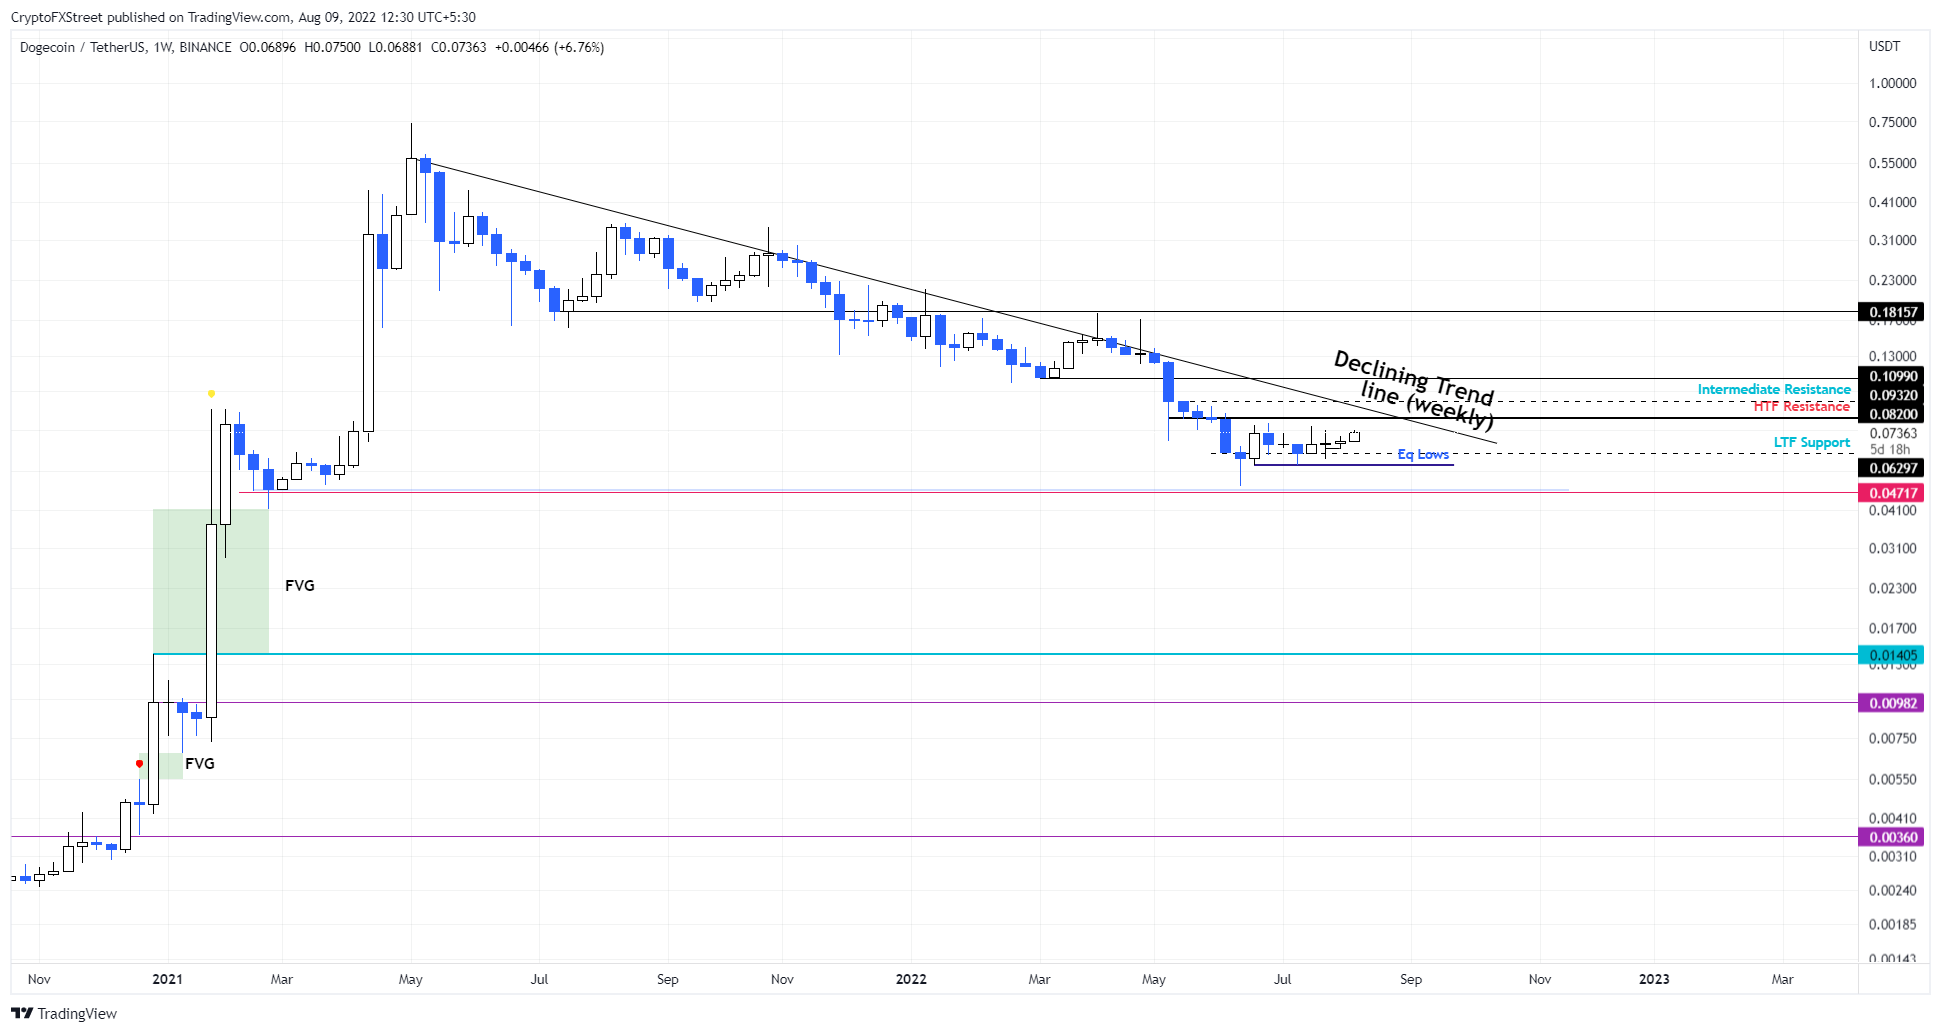
DOGE/USDT 1-week chart
Regardless of the inefficiencies, if Dogecoin price slices above the declining trend line at $0.0820, it will indicate a massive resurgence of bullish pressure. In such a case, the bearish thesis will have to wait while bulls take control.
If that is the case, Dogecoin price could make a run for $0.109 and $0.181, depending on the extent of bullish momentum.
Author

Akash Girimath
FXStreet
Akash Girimath is a Mechanical Engineer interested in the chaos of the financial markets. Trying to make sense of this convoluted yet fascinating space, he switched his engineering job to become a crypto reporter and analyst.