• Dogecoin price consolidates after a technical indicator flashed a local top signal.
  • The Relative Strength Index (RSI) also indicates that DOGE may be slightly overbought.
  • However, a close above the 27.2% Fibonacci retracement level may suggest the token could continue its rally higher. 

Dogecoin price could see further consolidation before continuing its rally. A technical indicator suggests that DOGE has printed a local top, and the canine-themed token could retest critical support levels before making its next big move. 

Dogecoin price slightly overbought

Dogecoin price appears to have broken out of a symmetrical triangle pattern to the upside, suggesting a bullish outlook.

On the 12-hour chart, Dogecoin price sliced above the upper boundary of the governing chart pattern on August 6, which resulted in a surge of 31%. The prevailing symmetrical triangle pattern suggests that DOGE could rally 45%, reaching an upper target of $0.314, near the 200 twelve-hour Simple Moving Average (SMA).

However, the Momentum Reversal Indicator (MRI) printed an MRI top signal, hinting that Dogecoin price could see a trend reversal and retest crucial support levels in the near term.

Adding credence to the correction thesis is the Relative Strength Index (RSI), which suggests that Dogecoin price was slightly overbought.

Dogecoin price may find immediate support at the 27.2% Fibonacci retracement level at $0.249. Should DOGE be able to close above this line of defense, the token may see a higher chance of continuing its rally.

The next line of defense for Dogecoin price is at the 38.2% Fibonacci retracement level at $0.236. 

DOGE USDT

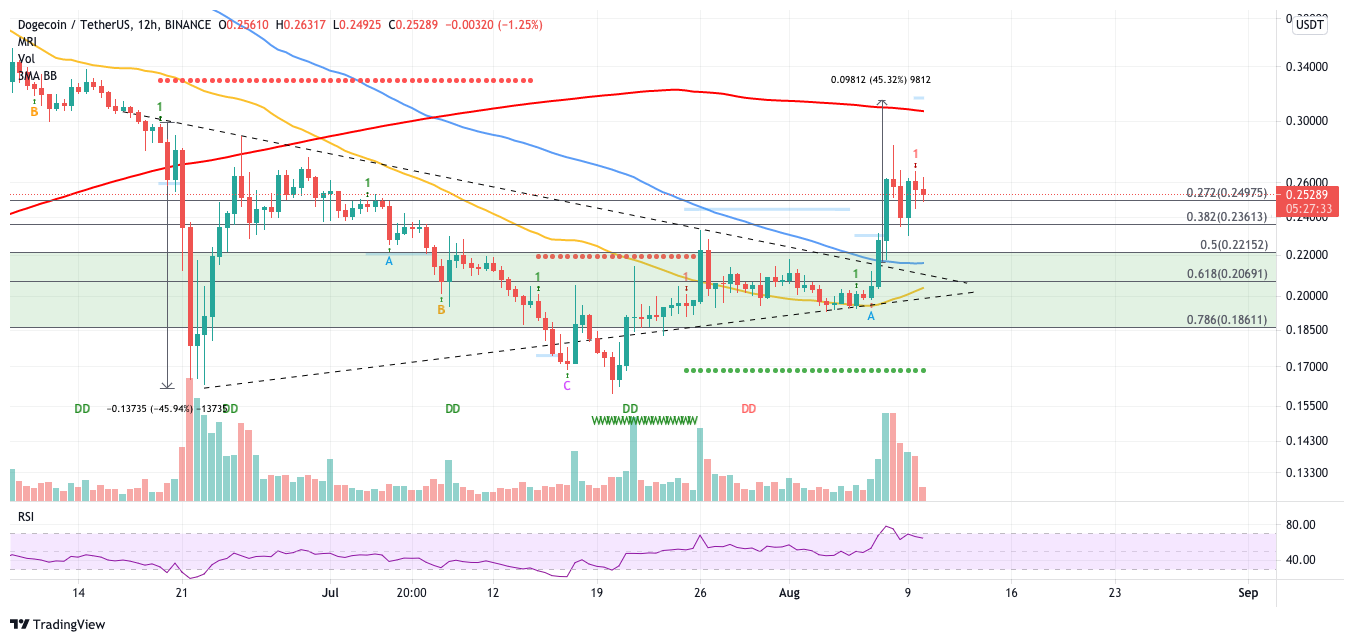
DOGE/USDT 12-hour chart

Further selling pressure may see DOGE collapse into the start of the demand barrier, at the 50% Fibonacci retracement level at $0.221 before testing the 100 twelve-hour SMA and the topside trend line of the symmetrical triangle.

Dogecoin price may identify further support at the 61.8% Fibonacci retracement level, coinciding with the 50 twelve-hour SMA at $0.206, should the buyers continue to struggle with lifting prices against the overpowering distribution of the sellers. 

If buying pressure prevails and sees DOGE price close above the 27.2% Fibonacci retracement level at $0.249, Dogecoin price could aim for a rally of 25% to $0.314, effecting the target given by the symmetrical triangle pattern. 


Note: All information on this page is subject to change. The use of this website constitutes acceptance of our user agreement. Please read our privacy policy and legal disclaimer. Opinions expressed at FXstreet.com are those of the individual authors and do not necessarily represent the opinion of FXstreet.com or its management. Risk Disclosure: Trading foreign exchange on margin carries a high level of risk, and may not be suitable for all investors. The high degree of leverage can work against you as well as for you. Before deciding to invest in foreign exchange you should carefully consider your investment objectives, level of experience, and risk appetite. The possibility exists that you could sustain a loss of some or all of your initial investment and therefore you should not invest money that you cannot afford to lose. You should be aware of all the risks associated with foreign exchange trading, and seek advice from an independent financial advisor if you have any doubts.

Join Telegram

Recommended content


Recommended Content

Editors’ Picks

Ripple wipes out weekly gains, experts comment on role of Ripple stablecoin

Ripple wipes out weekly gains, experts comment on role of Ripple stablecoin

Ripple declined to $0.52 on Thursday, erasing all gains registered earlier this week. Ripple SVP Eric van Miltenburg’s comments on the firm’s stablecoin, and how it is expected to benefit the XRP Ledger and native token XRP have raised concerns among crypto experts. 

More Ripple News

Hedera HBAR slips nearly 10% after air is cleared on mistaken link with giant BlackRock

Hedera HBAR slips nearly 10% after air is cleared on mistaken link with giant BlackRock

HBAR price is down nearly 10% on Thursday, partly erasing gains inspired by the misinterpreted link with BlackRock. Despite the recent correction, Hedera’s price is up 44% in the past seven days.

More Hedera News

The reason behind Bonk’s 105% rise and if you should buy now Premium

The reason behind Bonk’s 105% rise and if you should buy now

Bonk price has shot up 105% in the past five weeks. A retracement into $0.0000216 or the $0.0000152 to $0.0000186 imbalance would be a good buying opportunity. Patient investors can expect double-digit gains from BONK that could extend up to 70%.

More Cryptocurrencies News

Injective price weakness persists despite over 5.9 million INJ tokens burned

Injective price weakness persists despite over 5.9 million INJ tokens burned

Injective price is trading with a bearish bias, stuck in the lower section of the market range. The bearish outlook abounds despite the network's deflationary efforts to pump the price. Coupled with broader market gloom, INJ token’s doomed days may not be over yet.

More Injective News

Bitcoin: BTC post-halving rally could be partially priced in Premium

Bitcoin: BTC post-halving rally could be partially priced in

Bitcoin (BTC) price briefly slipped below the $60,000 level for the last three days, attracting buyers in this area as the fourth BTC halving is due in a few hours. Is the halving priced in for Bitcoin? Or will the pioneer crypto note more gains in the coming days? 

Read full analysis

BTC

ETH

XRP