Dogecoin Price Forecast: DOGE defeats support, aims for a 50% decline
- Dogecoin price fails at symmetrical triangle support, begins new phase in the bottoming process.
- DOGE volume contraction over the last nine days shows no emotion or commitment for the meme-cryptocurrency.
- A decisive close above the descending channel’s upper trend line could establish a new bullish narrative

Dogecoin price over the previous nine trading days fluctuated around the 50-day simple moving average (SMA), complicating a definitive outlook for DOGE. During that period, the digital asset formed a symmetrical triangle pattern that resolved to the downside yesterday, confirming a bearish turn.
Dogecoin price struggles to renew base of popularity
Dogecoin price declined about 75% from the May 8 high at $0.760 to the May 19 low at $0.195, putting it on the higher side of the range for declines in the cryptocurrency complex. However, the digital token did achieve a 130% bounce off the May 19 low into the May 20 high, closing DOGE back above the 50-day SMA, a level that has been instructive for the price action over the last nine days.
The decline below the triangle’s lower trend line yesterday has positioned Dogecoin price to test the descending channel’s lower boundary at $0.177. The projected DOGE decline will discover support at the confluence of the May 23 low at $0.246, with the channel’s midline at $0.242. Further support emerges at the May 19 low at $0.195.
A flash style of crash, similar to May 19, could expose Dogecoin price to a test of the 61.8% Fibonacci extension at $0.147 of the DOGE rally beginning April 1, representing a 50% decline.
Additional selling will strike the strategically important 200-day SMA at $0.112 and potentially the January 29 high at $0.100. It would be the first test of the moving average since December 2021.
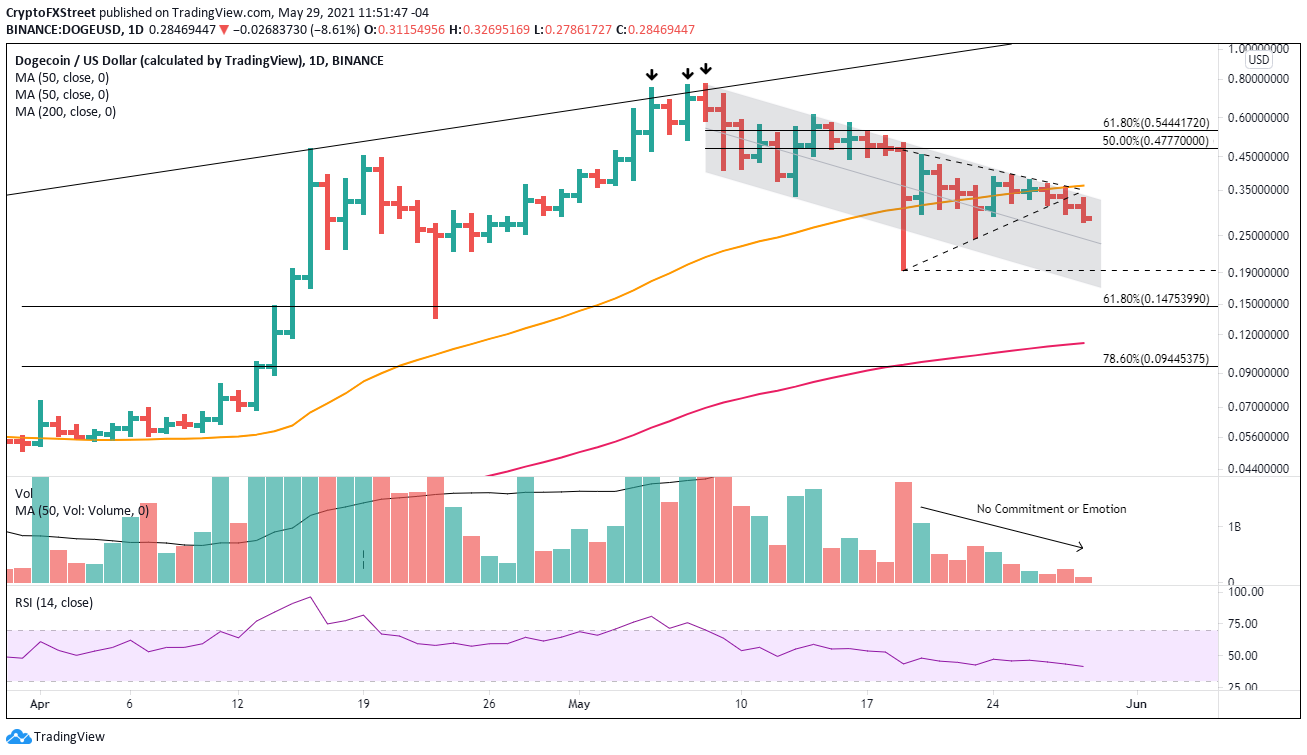
DOGE/USD daily chart
To entertain a positive outlook, Dogecoin price needs a daily close above the channel’s upper boundary at $0.335 and the 50-day SMA at $0.362. No further imposing resistance exists until the 50% retracement of the May correction at $0.477 and then the 61.8% retracement at $0.544.
MaybeIf Stanley Druckenmiller is correct, and the DOGE story is a “manifestation of the craziest monetary policy in history.” Or maybe, it is a social media story orchestrated by Elon Musk and Mark Cuban and inspired by the community lead Gamestop events that consumed the stock market in early 2021. Whatever the reason or reasons, the current Dogecoin price chart has been an enigma wrapped in a riddle.
Author

Sheldon McIntyre, CMT
Independent Analyst
Sheldon has 24 years of investment experience holding various positions in companies based in the United States and Chile. His core competencies include BRIC and G-10 equity markets, swing and position trading and technical analysis.


