Dogecoin price and on-chain metrics forecast 35% rally for DOGE
- Dogecoin price is trying to break through the $0.065 hurdle, which could trigger another rally.
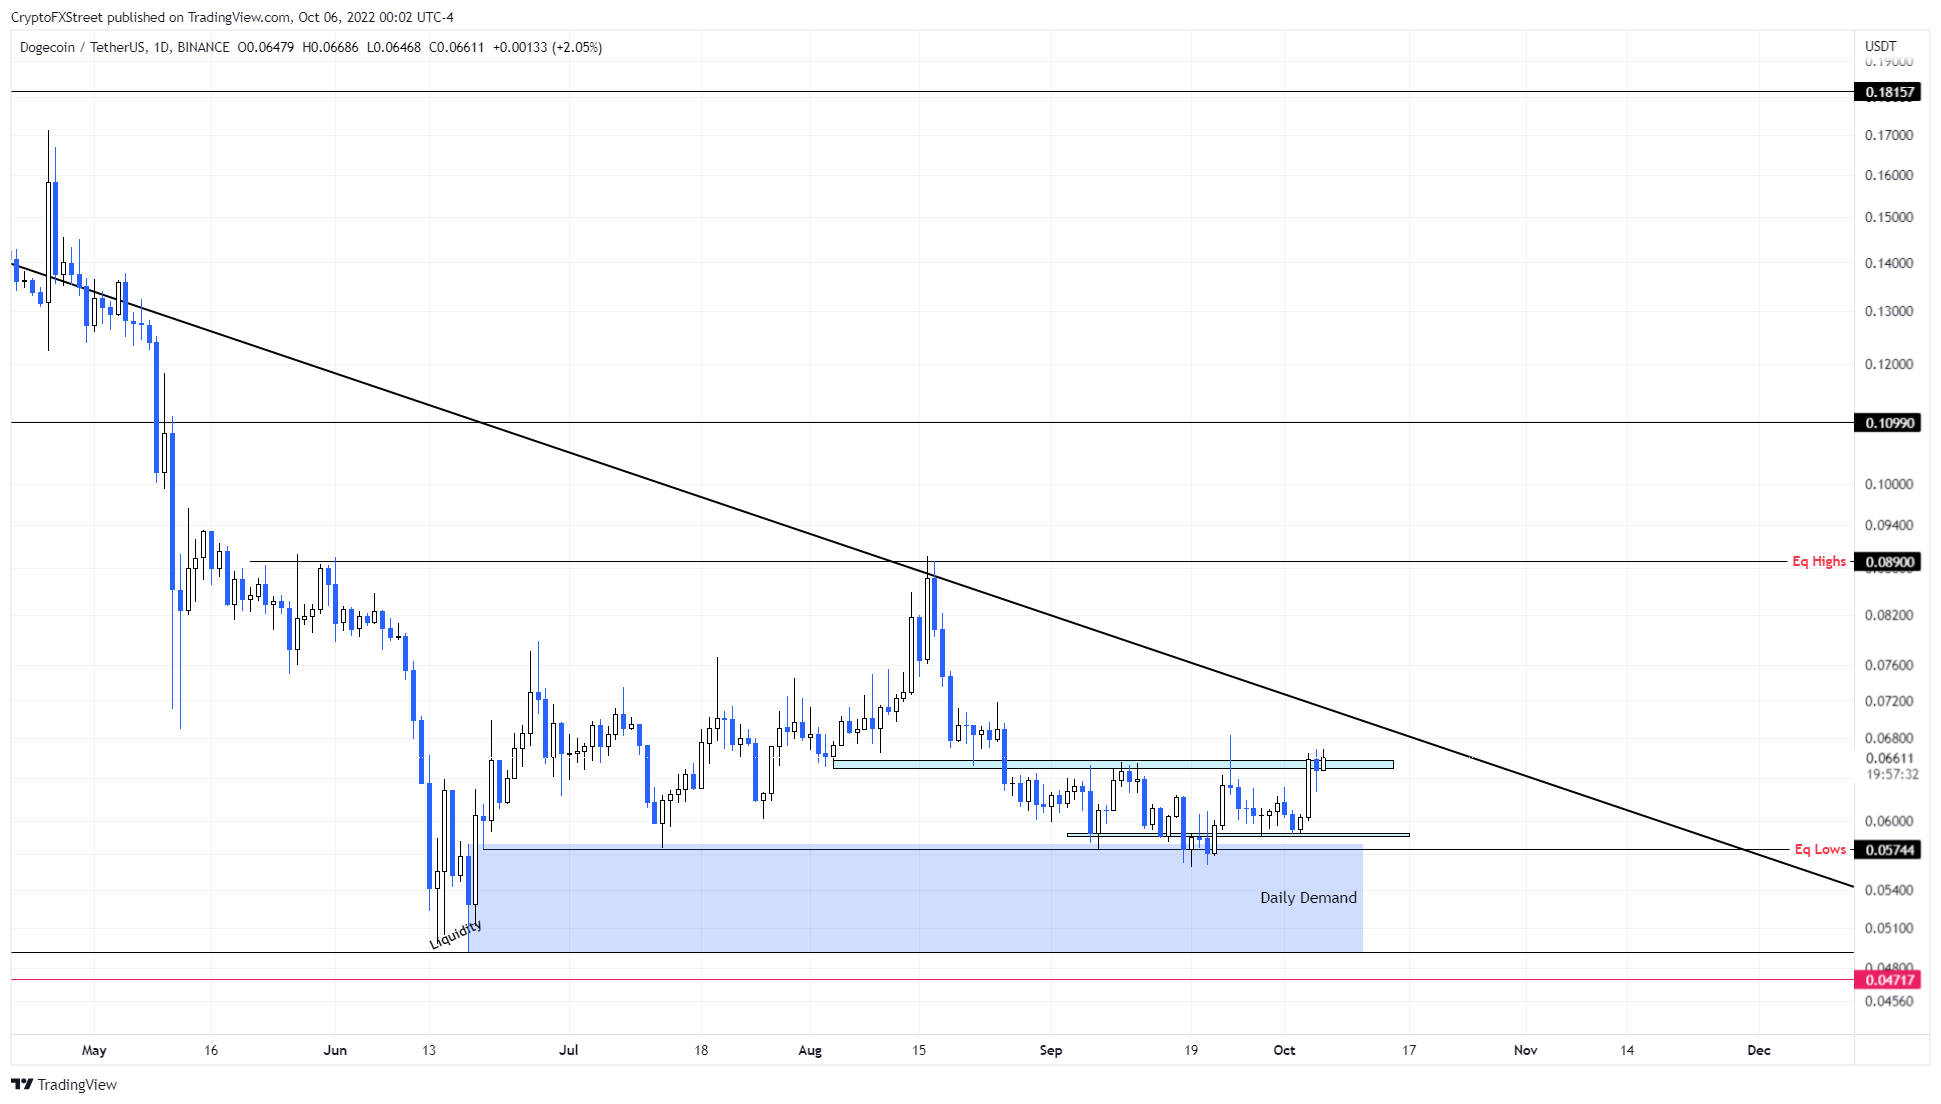
- A breakout above the multi-year, declining trend line could trigger a 35% run-up to $0.089.
- A daily candlestick close below $0.057 will invalidate the bullish thesis for DOGE.

Dogecoin price has been stuck trading between two barriers since August 28. The recent attempt to push through the upper limit indicates that DOGE buyers are ready to push it higher.
Dogecoin price edges closer to a breakout
Dogecoin price has been hovering below the $0.065 hurdle and above the $0.058 support floor for roughly 40 days. The last retest of the lower limit on October 3 resulted in a 13% upswing that is currently grappling with and attempting to break through the upper limit.
A successful flip of the $0.065 hurdle into a support level will indicate a resurgence of buyers and will propel DOGE to contend with the multi-year declining trend line. If the bullish momentum is strong and Dogecoin price slices through this blockade, it will signal a breakout.
A weekly candlestick close above this level will be significant as it will be the first time DOGE closed above it on a weekly basis in more than 500 days. Due to the nature of this move, investors can expect Dogecoin price to sweep the equal highs at $0.089 and collect the buy-stop liquidity resting above it.
In total, this move would constitute a 35% gain for the holders and is likely where a local top might form, depending on the market conditions.
DOGE/USDT 4-hour chart
IntoTheBlock’s Global In/Out of the Money (GIOM) model supports this massive expansion of Dogecoin price up to $0.089. This on-chain metric shows that roughly 352,000 addresses that purchased 60.80 billion DOGE at an average price of $0.088 are “Out of the Money.”
Therefore, a move into this territory could cause a spike in selling pressure due to investors trying to break even.
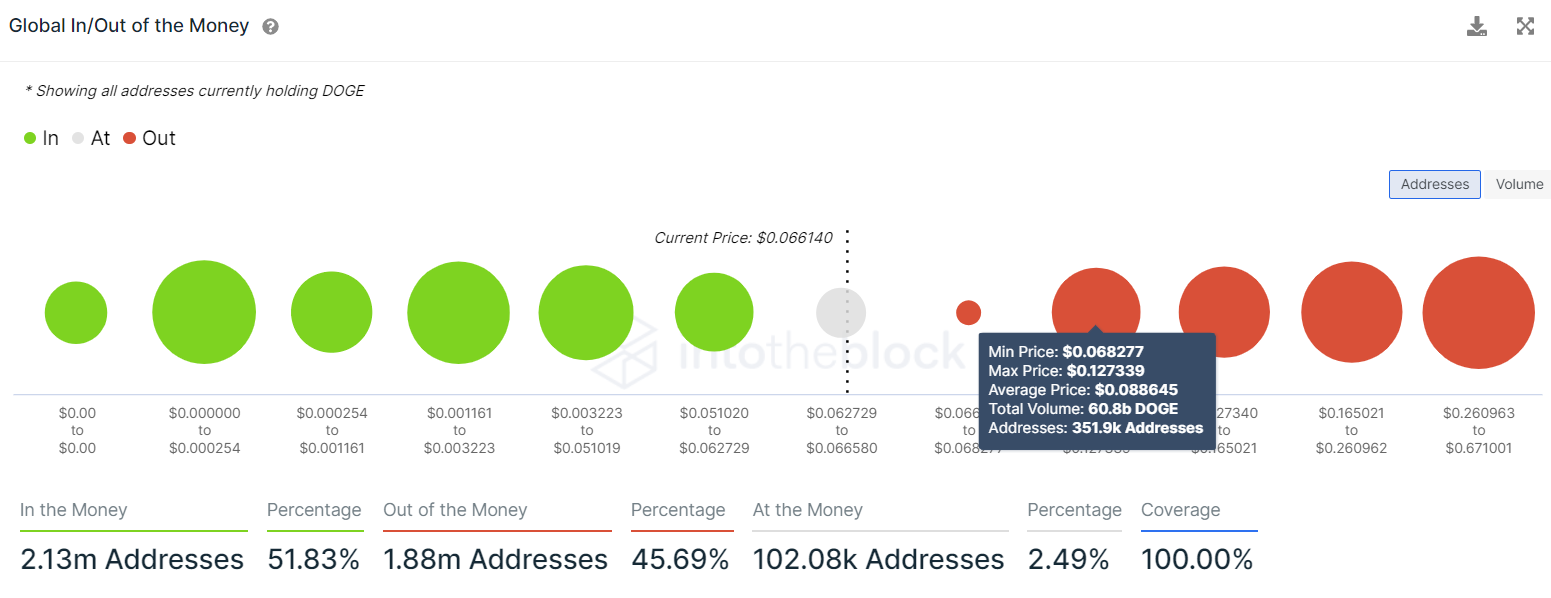
DOGE GIOM
On the other hand, if Dogecoin price fails to push past the declining trend line or the $0.065 hurdle, it will be a sign that buyers are not ready to make a move. This development could result in a sell-off that could knock DOGE to retest the lower limit at $0.058.
A daily candlestick close below $0.057 will invalidate the bullish thesis for DOGE and potentially trigger a retest of the $0.049 and $0.057 demand zone.
Author

Akash Girimath
FXStreet
Akash Girimath is a Mechanical Engineer interested in the chaos of the financial markets. Trying to make sense of this convoluted yet fascinating space, he switched his engineering job to become a crypto reporter and analyst.


