|

Decentraland price to retest $2.50 before MANA advances further

  • Decentraland price action has experienced a significant rally, moving nearly 70% from the January 22 low.
  • MANA is coming off a consecutive eight-day winning streak.
  • Bearish divergence may want a pullback from the recent rally.

Decentraland price action continues to be very bullish in the near term, with bulls completing a spectacular rally off the 50% Fibonacci retracement at $2.00. Bulls continued this momentum, pushing past $2.25 and $2.50, but halted shy of the $3.00 value area.

Decentraland price facing a retest of $2.50

Decentraland price action faces some selling pressure after failing to hold a close above the 38.2% Fibonacci retracement at $2.54. The following primary support zone for Decentraland is now the confluence zone of the Tenkan-Sen and Kijun-Sen at $2.50.

The drop over the past three trading days is likely due to the hidden bearish divergence between the candlestick chart and the Composite Index. This type of divergence occurs when the price chart prints lower highs/closes and the oscillator prints higher highs. It is a bearish continuation warning that is only valid if the prior trend was a downtrend – which Decentraland price was in.

MANA/USDT Daily Ichimoku Kinko Hyo Chart

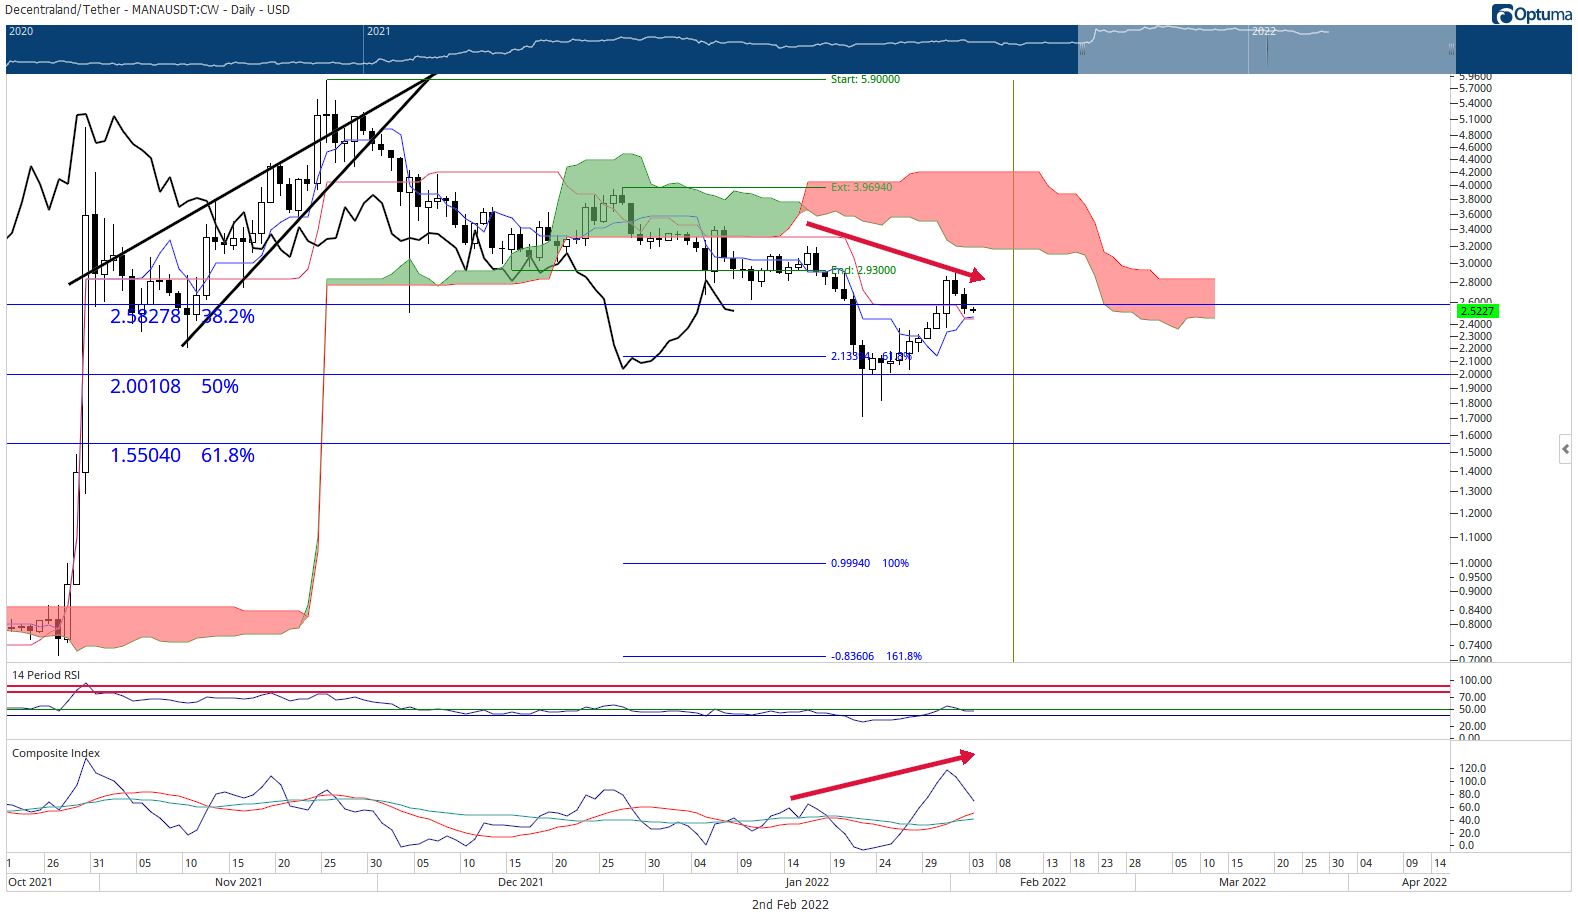
Failure to hold $2.50 would likely mean a strong drive to retest the 50% Fibonacci retracement at the $2.00 value area. This could generate further weakness that would threaten to drop MANA lower, possibly below the 2022 low.

If the $2.50 level holds as support, then there is a high probability of Decentraland price moving up to test the bottom of the Ichimoku Cloud (Senkou Span A) at $3.20

Author

Jonathan Morgan

Jonathan Morgan

Independent Analyst

Jonathan has been working as an Independent future, forex, and cryptocurrency trader and analyst for 8 years. He also has been writing for the past 5 years.

More from Jonathan Morgan
Share:

Editor's Picks

Ripple falters amid sell-off jitters and negative funding rates

Ripple (XRP) has come under pressure, drifting lower to $1.35 at the time of writing on Tuesday. The over 2% correction looks poised to erase the previous day’s gains, which lifted the remittance token to $1.42.

Bitcoin could risk $50,000 amid the US-Iran war, mirroring the Russia-Ukraine war losses

Bitcoin (BTC) remains at downside risk amid escalation in the Middle East war, as Iran retaliates against the US, Israel, and its neighbouring countries. Drawing parallels to the early days of the Russia-Ukraine war, Bitcoin could extend losses below $60,000. 

Crypto Today: Bitcoin, Ethereum, XRP pull back as sentiment remains in extreme market fear

The cryptocurrency market is broadly in the red on Tuesday as the Middle East grapples with an escalating war. Bitcoin (BTC) is in a pullback, trading below $67,000 at the time of writing, and most altcoins follow suit.

Bitcoin slips below $67,000 as risk-aversion grows amid escalating US-Iran war

Bitcoin price slides 3% on Tuesday, nearly erasing the previous day's rebound. US-listed spot ETFs recorded an inflow of more than $450 million while Strategy added 3,015 BTC on Monday.

Bitcoin Price Annual Forecast: BTC holds long-term bullish structure heading into 2026

Bitcoin (BTC) is wrapping up 2025 as one of its most eventful years, defined by unprecedented institutional participation, major regulatory developments, and extreme price volatility.

Bitcoin: Another month of losses, and it’s been five

Bitcoin (BTC) price is stabilizing around $68,000 at the time of writing on Friday, but the Crypto King is poised to close February on a fragile footing, marking its fifth consecutive month of losses since October and a rare start to the year with back-to-back monthly corrections.