Decentraland price to continue rebound rally, MANA likely to surge 15%
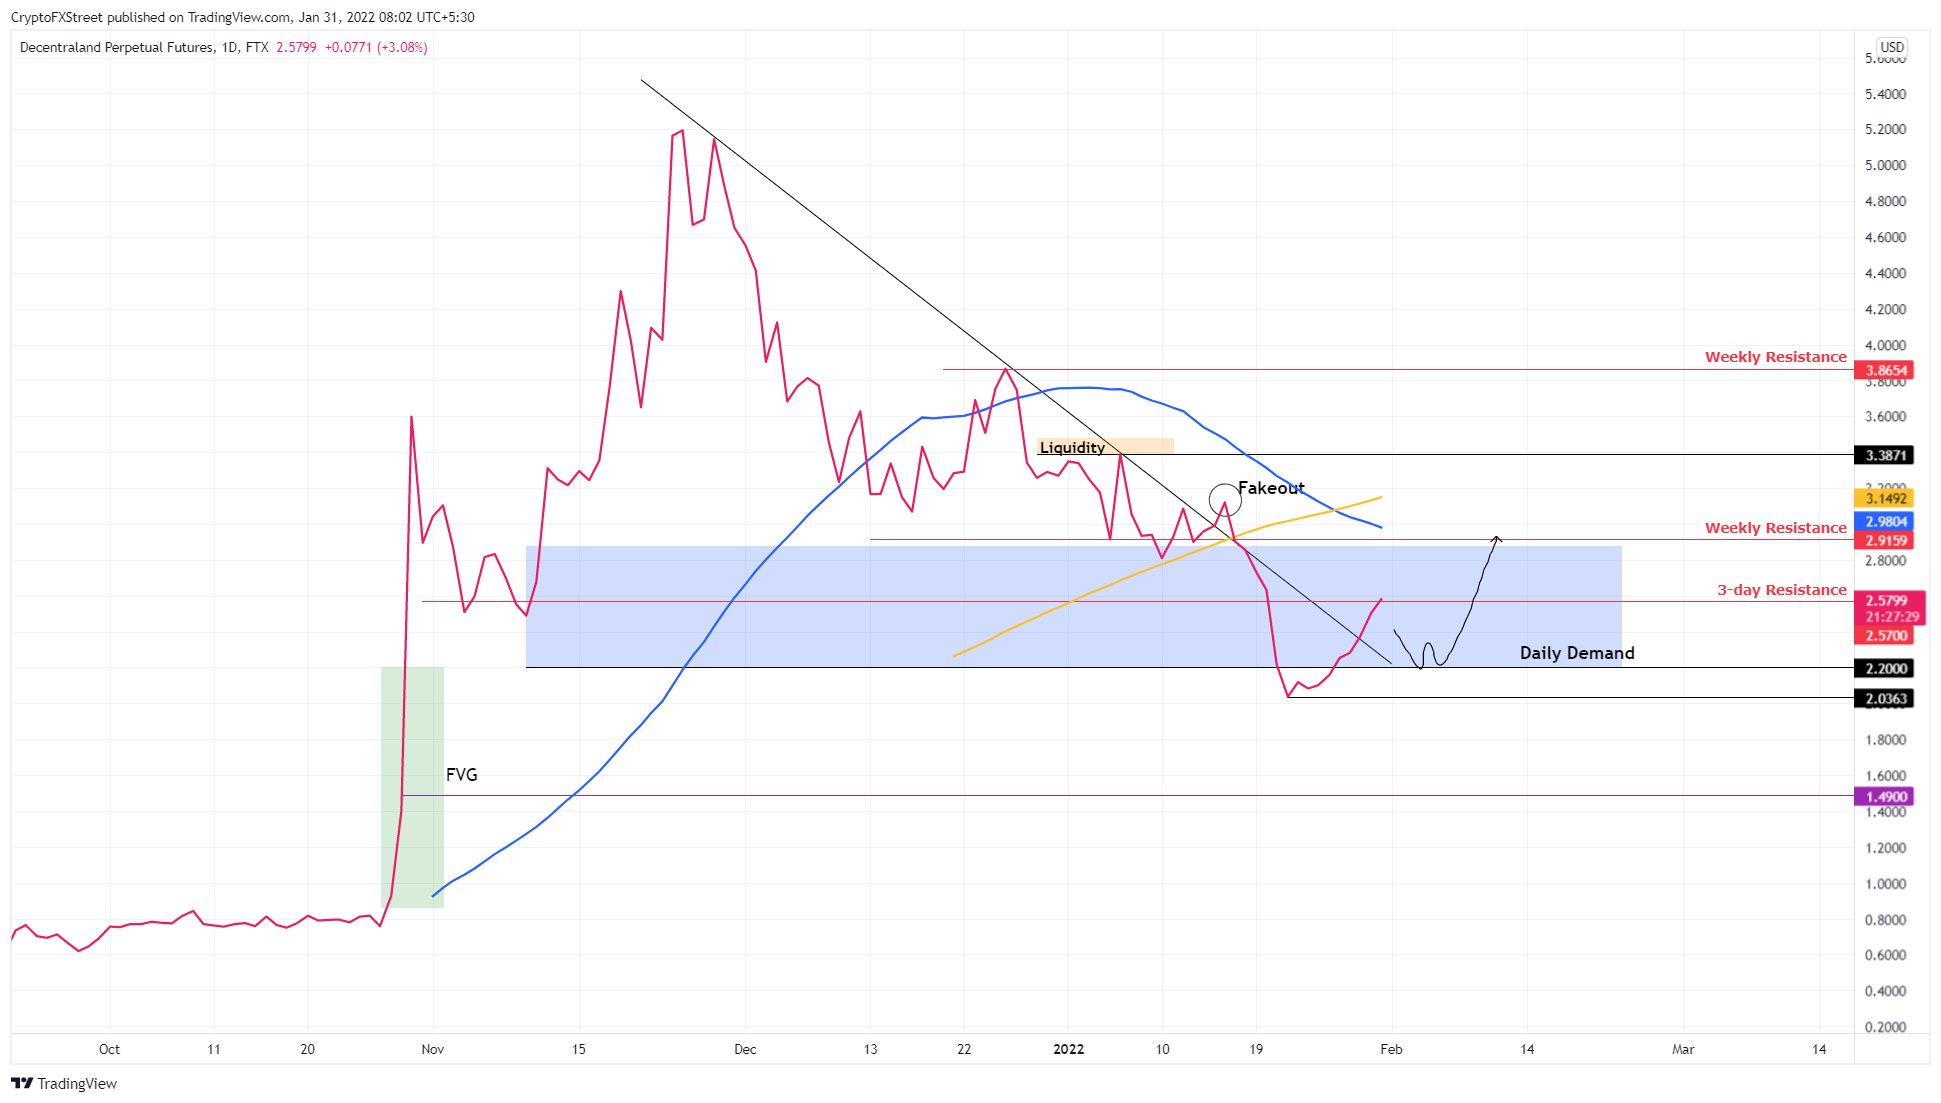
- Decentraland price slices through the three-day resistance barrier at $2.57, signaling an uptrend.
- A 15% rally to $3, coinciding with the 50-day SMA seems likely for MANA.
- A breakdown of the $2.06 support level will invalidate the bullish thesis.

Decentraland price has seen a massive rebound over the last week, indicating a respite from the bearish regime. This recovery rally seems to have overcome a crucial hurdle and is likely to continue its uptrend.
Decentraland price eyes recovery
Decentraland price dropped 35% after it failed to stay above the recently breached declining trend line on January 16. The resulting downswing was a result of holders selling their reserves of MANA combined with panic selling due to the Bitcoin flash crash.
Regardless, Decentraland price seems to have formed a base around the $2.06 barrier and reversed the downtrend as it bounced roughly 27% over the past nine days. This uptrend is currently facing a 3-day resistance barrier at $2.59, which it seems to have overcome at the time of writing.
If MANA confirms a flip of this barrier into a support level, there is a good chance Decentraland price will continue its uptrend. For this, the altcoin needs to slice through $2.59 and bounce off the same barrier. In such a case, investors can expect Decentraland price to rally another 15% to retest the weekly resistance level at $2.91 or the 50-day Simple Moving Average around $3.
Another scenario explores the possibility of rejection at $2.59, resulting in a pullback to $2.20. A bounce from this barrier could trigger Decentraland price to climb 33% to retest the $3 psychological level.
MANA/USDT 1-day chart
While things are looking up for Decentraland price, a failure to break through the $2.59 resistancelevel will indicate that the uptrend is running on fumes and that a pullback is likely. The $2.20 support level is where MANA buyers can regroup for another leg-up.
However, a daily candlestick close below the $2.06 barrier will create a lower low, invaldiating the bullish thesis. In this case, Decentraland price could revisit the $1.49 foothold.
Author

Akash Girimath
FXStreet
Akash Girimath is a Mechanical Engineer interested in the chaos of the financial markets. Trying to make sense of this convoluted yet fascinating space, he switched his engineering job to become a crypto reporter and analyst.


