Decentraland Price Prediction: MANA projects a 47% upswing
- Decentraland price could be preparing for a significant uptick toward $4.18 if the governing technical pattern is robust.
- However, MANA will face multiple challenges ahead before the optimistic target could be reached.
- If selling pressure increases, Decentraland will find immediate support at $2.72.

Decentraland price has formed a bullish chart pattern following a long period of consolidation. The prevailing chart pattern suggests that MANA could be headed for a major upswing, a 47% ascent following a slice above the upper boundary of the governing technical pattern.
Decentraland price eyes $4.18 next
Decentraland price has broken above the upper boundary of the falling wedge pattern on the daily chart, putting a 53% surge on the radar toward $4.18.
MANA has already kickstarted the climb following the slice above $2.72, at the topside trend line of the governing technical pattern. Decentraland price is facing immediate resistance at the 50% retracement level at $2.80.
Additional obstacles may emerge at the 50-day Simple Moving Average (SMA) at $2.99, then at the 61.8% Fibonacci retracement level at $3.06.
If buying pressure continues to increase, Decentraland price will confront another challenge at the 100-day SMA at $3.13, then at the 78.6% Fibonacci retracement level at $3.43 before MANA reaches the optimistic target at $41.8, coinciding with the resistance line given by the Momentum Reversal Indicator (MRI).
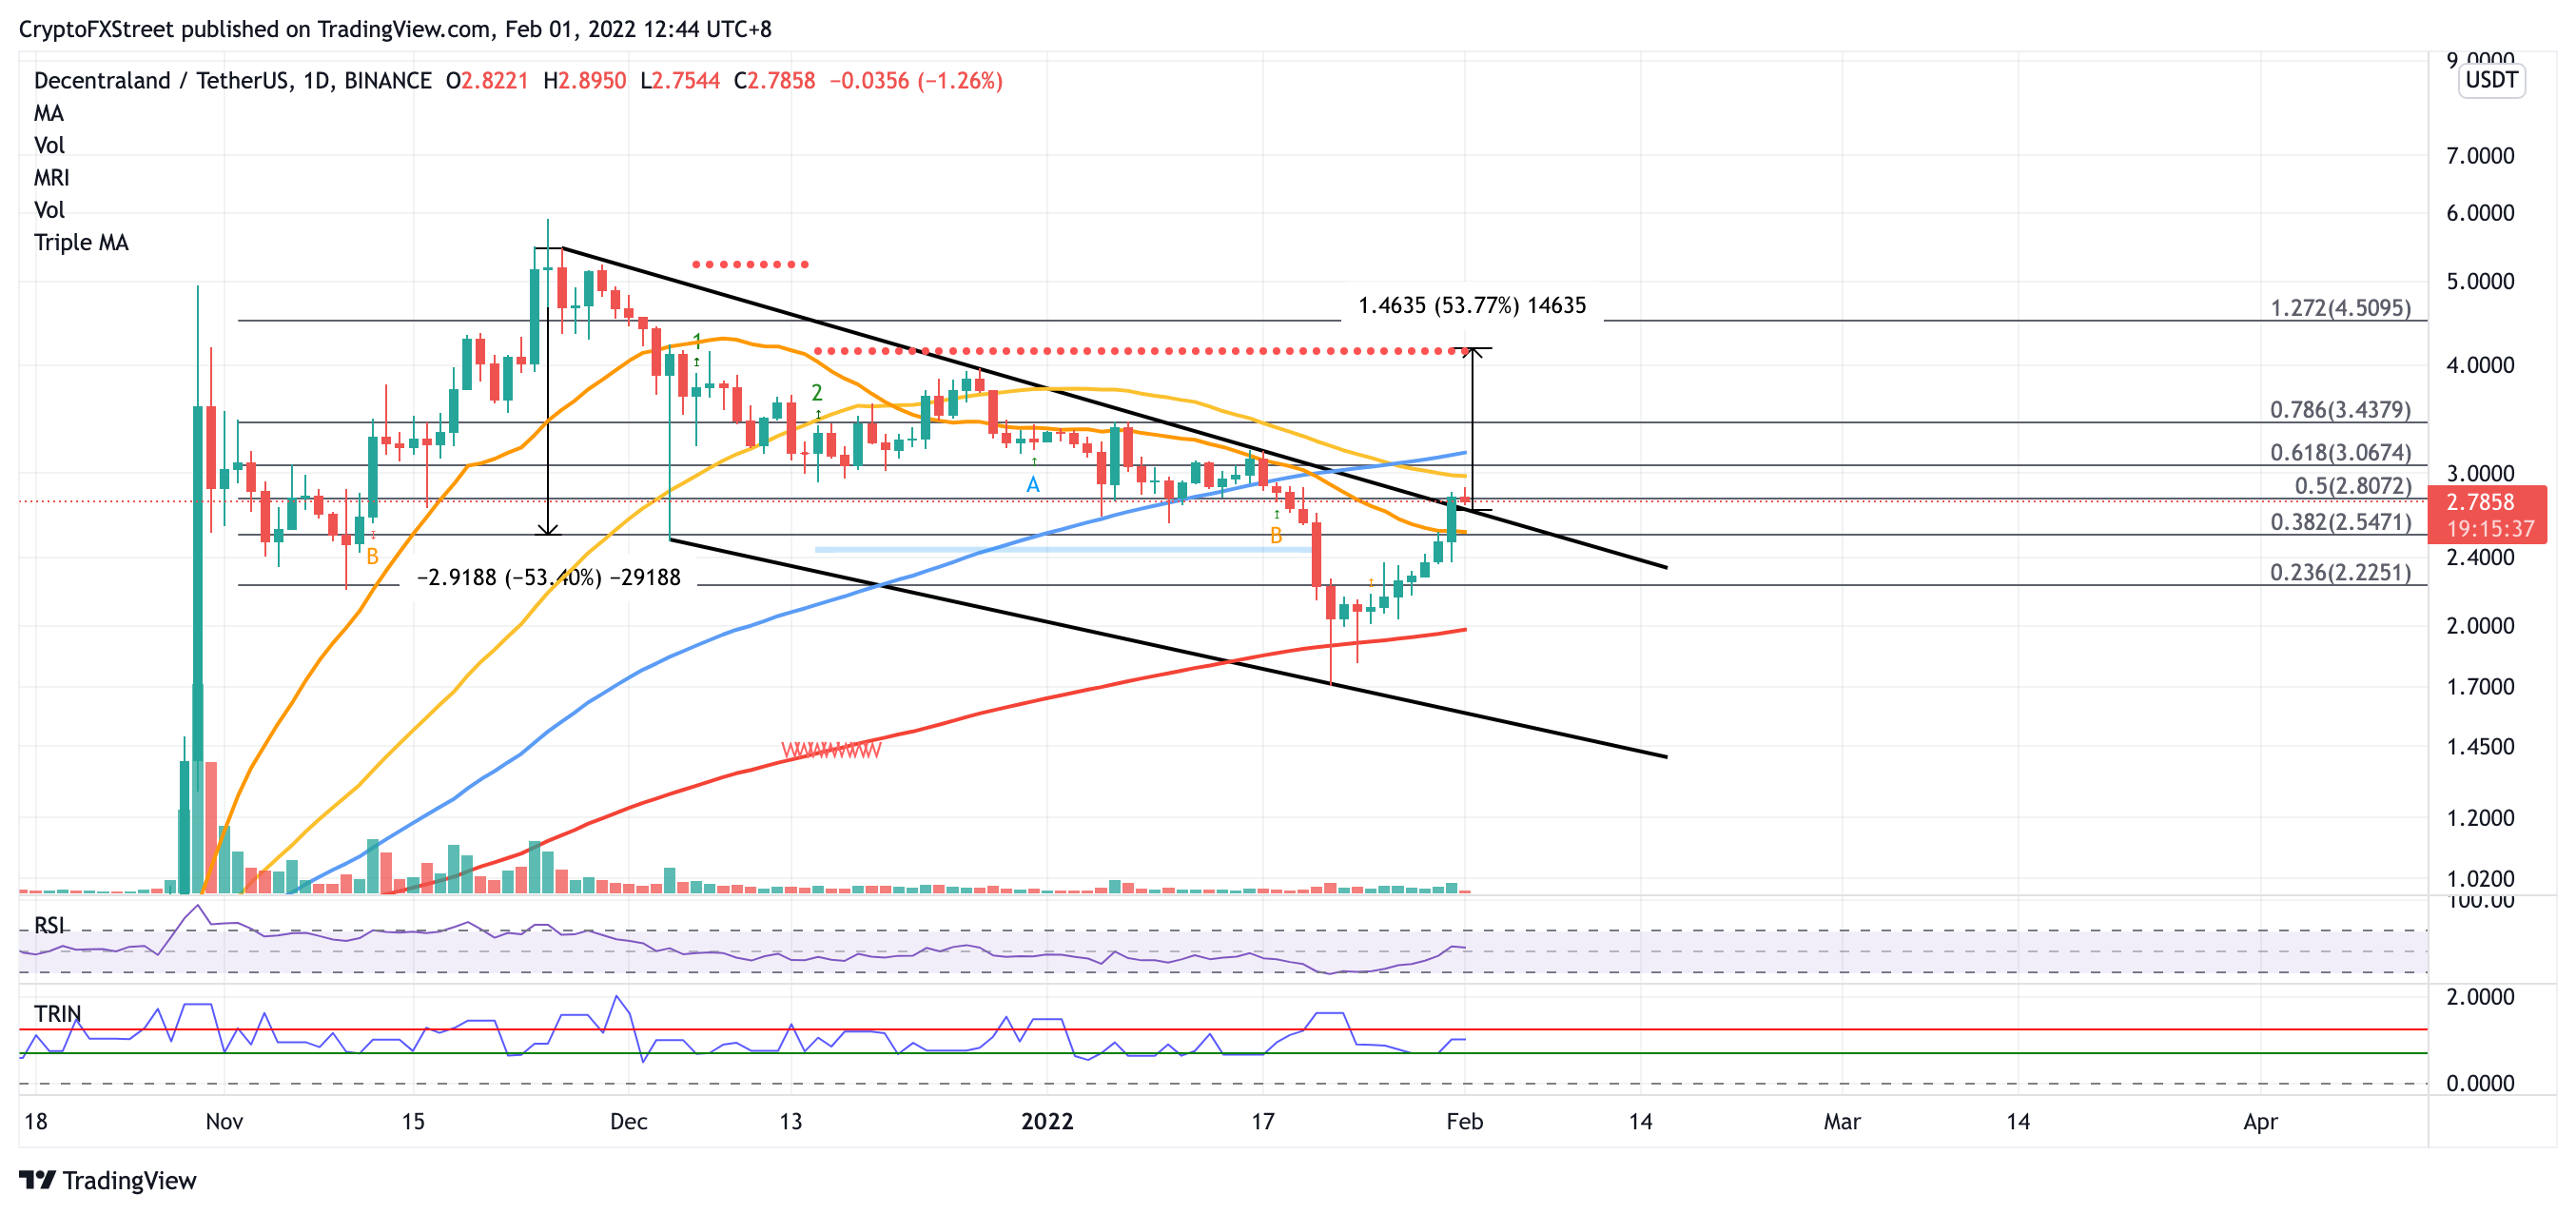
MANA/USDT daily chart
However, if selling pressure increases, Decentraland price could fall toward the lower boundary of the governing technical pattern at $2.72, then toward the 21-day SMA at $2.54, which intersects with the 38.2% Fibonacci retracement level.
A spike in sell orders may push Decentraland price lower toward the 23.6% Fibonacci retracement level at $2.22, before MANA tags the 200-day SMA at $1.97. The token could fall lower toward the lower boundary of the prevailing chart pattern at $1.55 if the aforementioned footholds fail to hold.
Author

Sarah Tran
Independent Analyst
Sarah has closely followed the growth of blockchain technology and its adoption since 2016.



