Curve DAO Token Technical Analysis: CRV bulls fight to regain control
- CRV makes a compelling move upwards following a buy signal on the daily chart.
- The upper boundary of the descending channel must be broken for CRV to embark on recovery fully.

Curve DAO Token has sustained a bearish narrative since the spike that immediately followed its launch in August. The flash rally to 24 was unsustainable, but the correction that followed has been unstoppable.
Support seems to have been established at $0.34 in aided by a descending parallel channel. CRV/USD's bounce off support has slowed down on reaching the upper boundary of the channel. The token is exchanging hands at $0.37 amid a growing push to place the cryptoasset in an upward trajectory.
Curve Finance is the issuing company behind CRV and a decentralized exchange liquidity pool executing on Ethereum. The platform has been tailor-made for "extremely efficient stablecoin trading."
On the other hand, Curve DAO Token was launched on August 14, 2020. According to Curve Finance, CRV is a governance token that employs time-weighted voting as well as value accrual mechanisms. The token allows users to lock their funds to ensure long-term liquidity and earn rewards for the same.
Curve DAO Token nurturing an uptrend
After clearing the resistance at the channel's middle boundary, CRV is fighting for a breakout above the upper trendline. The Relative Strength Index (RSI) highlights the bullish case with the upward action from the overbought area. Further movement above the midline will call for more buy orders, creating the volume to sustain the uptrend.
CRV/USD 1-hour chart
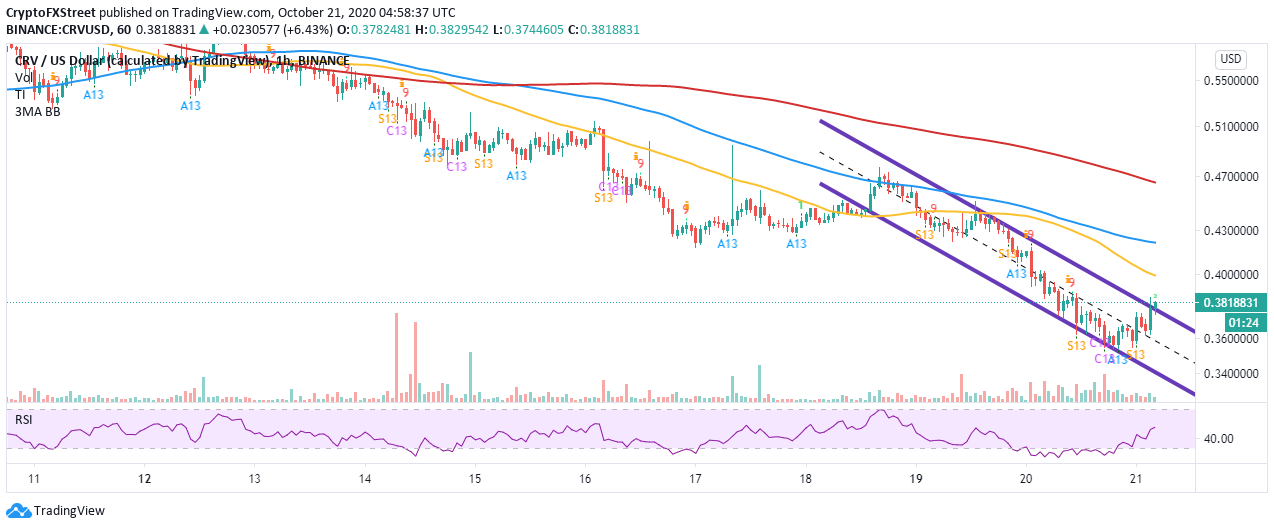
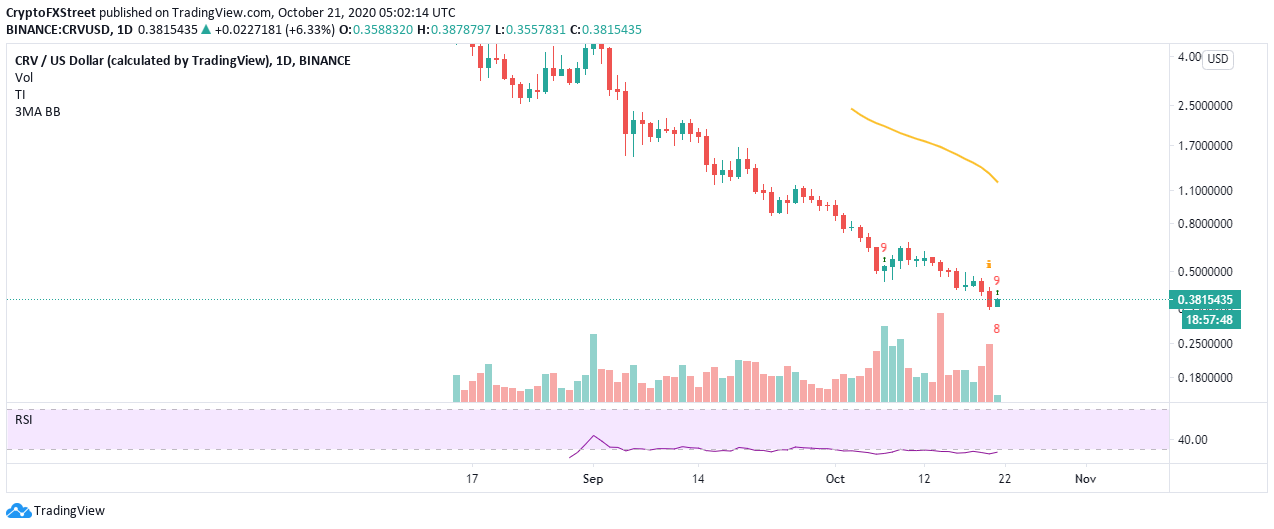
Several hurdles ahead of CRV are likely to delay the uptrend, starting with the 50 Simple Moving Average (SMA), 100 SMA and the 200 SMA in the 1-hour timeframe. However, the TD Sequential indicator presents a buy signal in the form of a red nine candlestick on the daily chart. This adds weight to the bullish scenario, which, if sustained, may push CRV above $0.1.
CRV/USD daily chart
Looking at the other side of the picture
According to IntoTheBlock's IOMAP, the road ahead of Curve DAO Token might only allow the uptrend a smooth sailing above $0.4. The robust resistance running from $0.42 to $0.4 is likely to invalidate the bullish outlook to $0.1. Here, 236 addresses previously bought 2.7 million CRV.
CRV IOMAP chart
-637388551736378336.png)
On the downside, the lack of a formidable support area means that CRV could still plunge further, mostly if the upper boundary of the descending parallel channel remains intact. However, the model presents weak support between $3.6 and $3.8. Here, 11 addresses brought roughly 95,200 CRV.
Author

John Isige
FXStreet
John Isige is a seasoned cryptocurrency journalist and markets analyst committed to delivering high-quality, actionable insights tailored to traders, investors, and crypto enthusiasts. He enjoys deep dives into emerging Web3 tren



