Bitcoin seems poised to fill CME gap at $9,600, but how likely would it be?
- Bitcoin price pullback below $10,000 is likely to be filling the CME gap.
- Some technical levels could invalidate the bearish outlook.
- Bitcoin price drop to $9,600 could pull other major digital assets downwards, including Ethereum and Ripple.

The flagship cryptocurrency has been on a downward spiral for a couple of days now. The declines commenced just after BTC failed to hold above $12,000 following a breakout earlier this week. BTC/USD succumbed to an increased in the selling pressure, exploring levels slightly below $10,000. Many analysts weighed in on the matter believe that the pullback could be Bitcoin's way of closing the CME BTC Futures gap before it resumes the uptrend.
CME refers to the Chicago Mercantile Exchange, the global leader in derivatives trading. Traders can buy and sell virtual anything on this platform, including metals, energy, real estate, and even Bitcoin. On the other hand, a gap is a region on a chart that is missing trades. In other words, it is the areas between the close and the opening prices of a trading asset. The gap occurs when the price moves drastically, either up or down, mainly during outside trading hours of CME Bitcoin Futures markets.
For instance, on August 25 CME gap occurred between a closing price of $11,320 and an opening price of $11,405. Another similar gap can be observed on the chart, happening on August 28 at $11,630 and $11,745 traded on August 31.
CME BTC Futures 1-hour chart
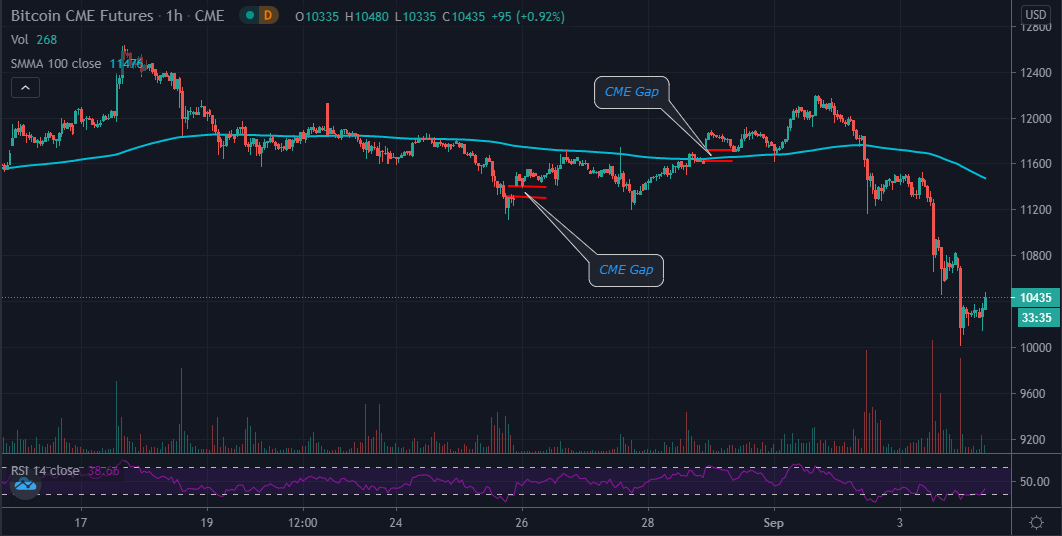
Following the gap on August 25, Bitcoin price climbed towards $12,000 but hit $11,725. A pullback from this resistance forced Bitcoin to close the gap with a drop in price to $11,205. A reversal ensued, and the digital gold stepped above several hurdles, briefly settling above $12,000 earlier this week.
The second gap got filled during the run-up to $12,000 and the losses in the last 48 hours. However, the gap that Bitcoin currently seeks to fill occurred on July 24 at $9,600. It is vital to note that not all gaps get filled because other technical levels tend to overshadow them.
Bitcoin technical analysis
According to the 4-hour BTC/USD chart, a bullish reversal is likely to be supported. The formation of a Harami candle suggests that the bulls are gaining momentum as sellers lessen their grip. Also, the Relative Strength Index (RSI) seems to be stepping out of the oversold region. This indicator signals that Bitcoin can invalidate the bearish outlook in favor of upward price action. Glancing upwards, resistance at $10,500 will be the medium test for Bitcoin; stepping above this level will boost BTC to $11,000. However, if rejected, a breakdown below $10,000 could close the CME gap to $9,600.
Meanwhile, the Moving Average Convergence Divergence (MACD) illustrates a somewhat bearish outlook for the leading cryptocurrency. The MACD is a lagging indicator and currently validates the 50 Simple Moving Average (SMA) wide gap below the 200 SMA in the same 4-hour range. It also emphasizes the recent death cross at $11,500 (the 50 SMA crossed below the 200 SMA), which subtly signals Bitcoin's likelihood of closing the week at a price lower than $11,500.
BTC/USD 4-hour chart
 (33)-637348099779184267.png)
According to Willy Woo, a well-known on-chain analyst within the crypto community, Bitcoin price trading sub $10,000 means that the price is testing "the long term resistance trendline as support. That will be a solid foundation to build from." Regarding on-chain analysis (currently gaining popularity in crypto markets), Will Woo says that there is a likelihood of a "two-three weeks of pullback, inside of a larger bullish structure."
Overall my interpretation of on-chain and on-exchange technical is a 2-3 weeks of pull back, inside of larger bullish structure.
— Willy Woo (@woonomic) August 25, 2020
Overall my interpretation of on-chain and on-exchange technicals is a 2-3 weeks of pull back, inside of larger bullish structure.
Maybe like this. pic.twitter.com/E5XOZJSnTZ
Last but not least, a drop to $9,600 will depend on whether Bitcoin will rise above the hurdle pat $10,500 or not. Bitcoin's idea revisiting this price level would be detrimental for most of the major crypto assets, such as Ethereum and Ripple. Ethereum has, in the recent past, increased its correlation with Bitcoin. However, for a couple of weeks, the smart contract giant broke away from BTC to trade new yearly highs at $486. However, following the recent slide to the support at $370, ETH's uptrend could suffer sabotage as BTC falls to $9,600.
Ripple is yet to find its bearing despite being the cross-border payments giant. Its price is somehow dependent on Bitcoin's price unless an event or development is setting it apart. In this case, a significant XRP retracement is possible if Bitcoin dives to $9,600.
Author

John Isige
FXStreet
John Isige is a seasoned cryptocurrency journalist and markets analyst committed to delivering high-quality, actionable insights tailored to traders, investors, and crypto enthusiasts. He enjoys deep dives into emerging Web3 tren


