Crypto.com price risks 8% downswing as support shrinks
- Crypto.com price is on the verge of validating a falling triangle breakout.
- CRO risks falling deeper into losses due to the absence of solid support areas.
- Bears hold the reins as CRO whales ramp up the selling spree.

Crypto.com price is down almost 2% as bears leave no stone unturned on Friday across the crypto market. CRO will likely conclude its extended consolidation period with more losses – possibly below $0.1000.
However, its technical picture shows that another retracement might not be the worst. If anything, Crypto.com price could use the opportunity to attract already sidelined investors before bullishly reversing the trend.
Assessing the possibility of an 8% dip to $0.0994
After Crypto.com price topped $0.1250 in September, support formed at $0.1080. Subsequently, recovery moves weakened, culminating in a higher downward trend. These two price movements formed a falling triangle that could see CRO plunge 8% to $0.0994.
A falling triangle is a bearish chart pattern characterized by lower highs and a lower support level. The falling trend line indicates that sellers are growing stronger, and a breakout is imminent. Although Crypto.com price is consolidating with a bearish bias, traders must wait for a breakout below the horizontal support level.
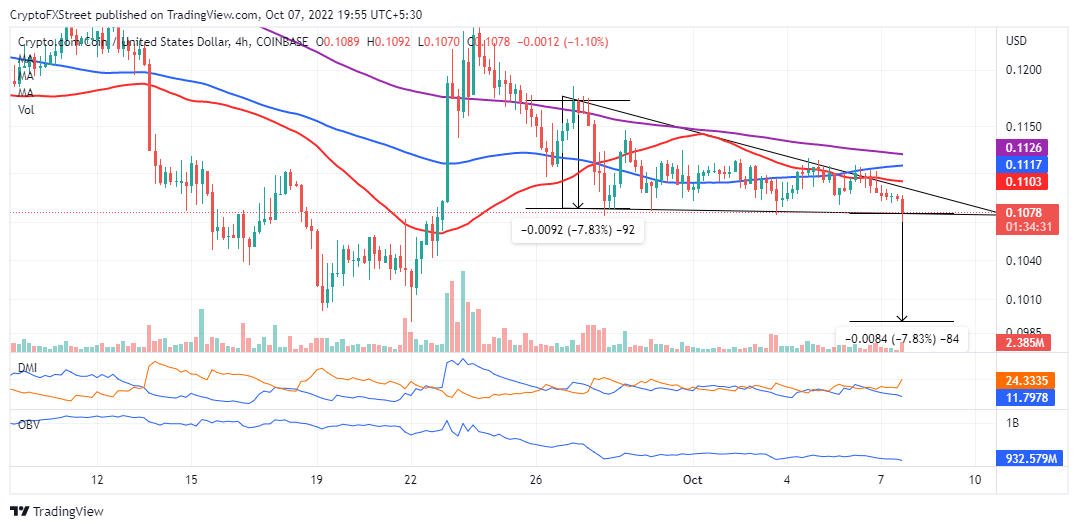
CRO/USD four-hour chart
Crypto.com price may validate the foreshadowed downtrend in the short-term based on insight from the DMI (Directional Movement Index) and the OBV (On Balance Volume). The former reveals a negative signal, with the divergence between the –DI and the +DI still increasing. Similarly, traders appear to be ramping up their activities as the OBV slides further below the 1 billion mark.
Whales mount pressure on Crypto.com price
Large volume holders have been selling CRO even as the price falls. According to the Supply Distribution, on-chain metric by Santiment addresses with between 10,000 to 100,000 tokens now hold at 443 after a sharp drop from 476 on September 24. As for the addresses with between 1 and 10 million tokens, the drop to 1,018 has been gradual over the last three months after peaking at 1,128 on July 12.
 [17.25.40, 07 Oct, 2022]-638007546397041954.png)
CRO Supply Distribution
Overhead pressure tends to increase as whales unload their bags. The selling spree also shows that Crypto.com is far from touching its floor price and losses are likely to carry on.
-638007547190197282.png)
Crypto.com IOMAP model
The lack of solid support areas is driving the bearish narrative, as observed from the IOMAP on-chain metric. On the other hand, massive resistance levels at $0.1098 and $0.1124 will continue limiting price movements.
Crypto.com price must collect enough liquidity to climb the ladder because investors who bought at those levels may choose to sell at their breakeven points, thus contributing to the downward force.
Author

John Isige
FXStreet
John Isige is a seasoned cryptocurrency journalist and markets analyst committed to delivering high-quality, actionable insights tailored to traders, investors, and crypto enthusiasts. He enjoys deep dives into emerging Web3 tren




