Top 3 Prediction Bitcoin, Ethereum, Ripple: BTC may drop to $34,000, taking the rest of the market with it
- Bitcoin price defining a bearish top formation after weeks of indecision.
- Ethereum price blitzes bears with steady price momentum.
- Ripple price fails pattern test, poised for further losses.

Bitcoin price outlines the potential for a head-and-shoulders top after months of complex and frustrating price action. Ethereum price successfully navigates recent crypto market oscillations with a new milestone. XRP price indecision and failures overwhelm bullish aspirations in the short term.
Bitcoin price continues to undermine bullish narrative
The 12-hour chart reveals a unique topping process, with the probability of a head-and-shoulders pattern seizing the narrative from the longstanding bullish projections for the bellwether cryptocurrency. The pattern began forming at the March high.
Bitcoin price shows a completed left shoulder, a head and right shoulder near completion, with both shoulders lower than the head. The left shoulder is slightly higher than the right shoulder, but studies show that a marginally higher left shoulder generates superior returns post-breakout. The overall symmetry makes the pattern more identifiable. Still, the downward slope of the neckline marginally lowers the probability of fully reaching the measured move target of 25% from the neckline.
Adding to the pattern’s strength is that the right shoulder is being defined by a minor head-and-shoulders pattern, providing an earlier entry price for eager bearish speculators. The measured move target of the minor pattern is 10%, with a price target of $53,357. The initial decline would put Bitcoin price below two tactical moving averages on the 12-hour chart.
A final addition to the new bearish narrative is the approaching “Death Cross” on the 12-hour chart, as the 50 twelve-hour simple moving average (SMA) at $55,308 is edging closer to the 200 twelve-hour SMA at $53,524. The potential crossover would signal a decisive downturn for the flagship cryptocurrency and increase the validity of the bearish narrative now being presented.
If Bitcoin price undercuts the neckline of the minor head-and-shoulders pattern, it will target a race to $53,357, followed by a lunge down to the neckline of the major head-and-shoulders pattern currently at $45,630. Some support will surface at that price level, but the critical barrier to the full completion of the bearish outlook is the 38.2% Fibonacci retracement of the March 2020-April 2021 rally at $41,581.
A failure to hold the 38.2% retracement exposes Bitcoin price to an immediate decline to the intersection of the 50% retracement at $34,378 with the bigger head-and-shoulders measured move target of $33,885, representing a 25% decline from the neckline and a 39% plunge from price at the time of writing.
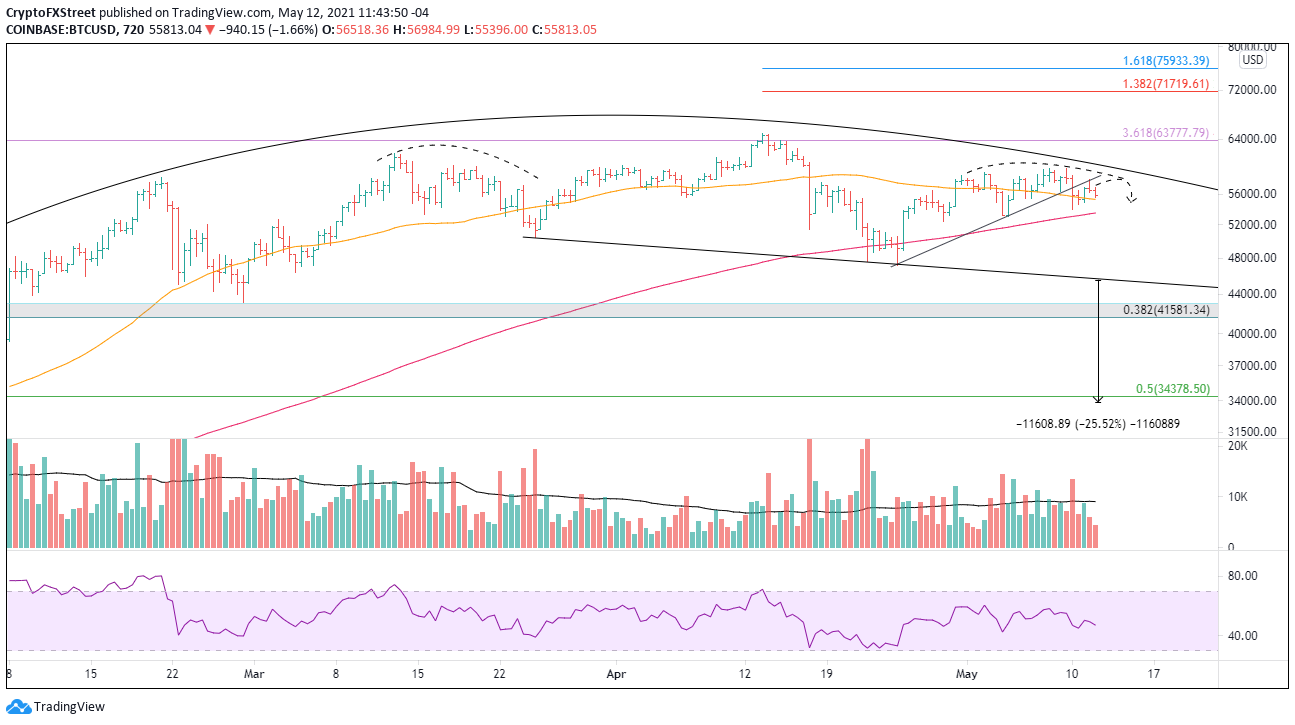
BTC/USD 12-hour chart
A new, collective advance in the crypto market could emerge that finally lifts Bitcoin price beyond the 361.8% extension of the 2017-2018 decline at $63,777. It would direct the crosshairs at the higher extension levels of the April decline at $71,719 and $75,933.
Ethereum price discovers resistance at Fibonacci extension
Over the last seven weeks of gains, Ethereum price has rallied almost 150%, establishing it as one of the best seven-week periods in the history of the altcoin. As a result, daily and weekly Relative Strength Index (RSI) readings strike an overbought condition. Still, in the case of the daily RSI, there is no bearish momentum divergence that could undermine the medium-term bullish outlook.
For the last three days, Ethereum price has struggled with the 361.8% Fibonacci extension of the April 22-23 decline at $4,232. Part of the restlessness can be attributed to the magnet effect of large round numbers, in this case, $4,000.
Due to the overbought condition and a potential unfolding of a collective top in the cryptocurrency market, Ethereum price could undergo a corrective process that may test the 261.8% extension of the 2018 decline at $3,587, or even the 38.2% retracement of the February-May advance at $3,202.
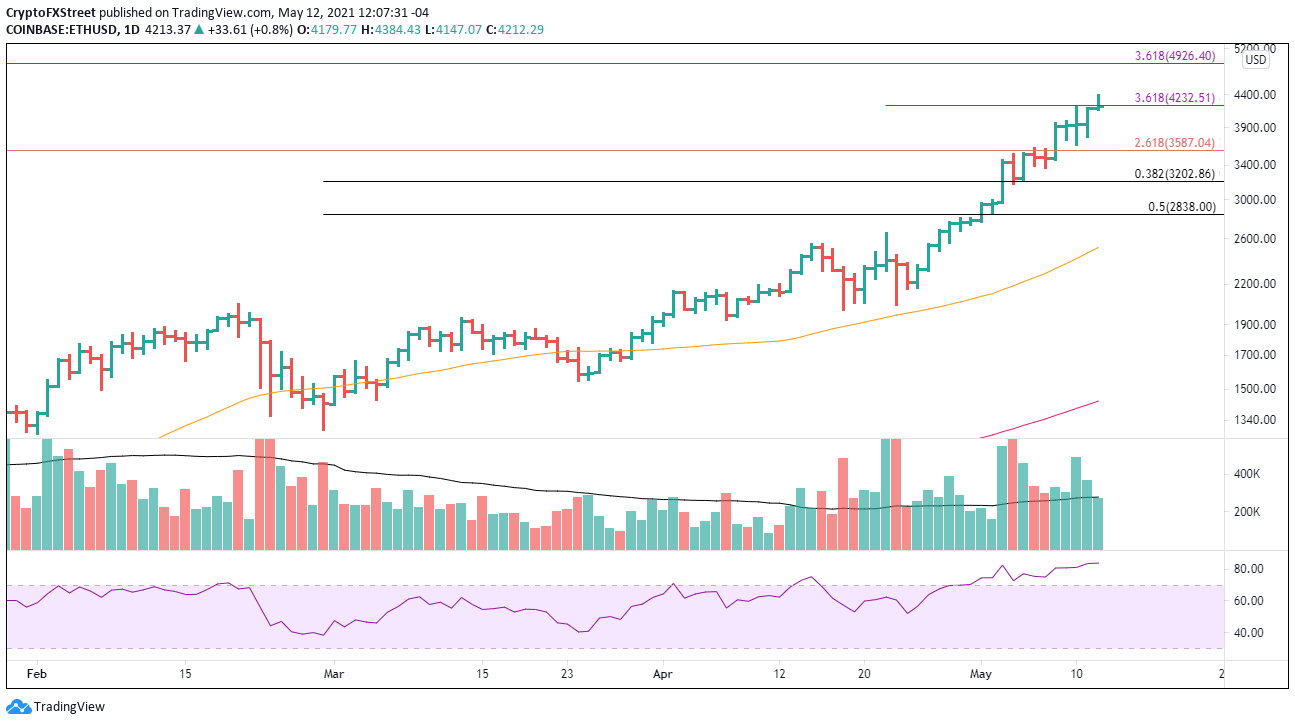
ETH/USD daily chart
In light of the tremendous momentum, it is conceivable that Ethereum price extends the advance to the 361.8% extension of the 2018 market decline in the immediate future. It would be a gain of around 15% from price at the time of writing.
XRP price pattern has bearish implications
On May 10, XRP price triggered a bearish double top pattern with a trade below $1.315. It has since bounced back, but the 50 twelve-hour moving average has turned downwards, adding increased pressure on the international settlements token.
A jump in selling pressure should throw XRP price below the May 10 low at $1.225 and the 100 twelve-hour moving average at $1.186. Additional support appears at the 50% retracement of the 2021 advance at $1.067, but the most recognizable support is the psychologically important $1.00.
If XRP price cannot manufacture a rebound from around $1.00, Ripple will test the support framed by the April low at $0.874 and the 61.8% Fibonacci retracement at $0.856. The price range defined by the November 2020 high at $0.780 and the February high at $0.757 should arrest any residual selling pressure.

XRP/USD 12-hour chart
For now, a bullish resolution to the May price oscillations seems remote, but a rally above the May 5 high at $1.765 would force a reconsideration of the developing bearish thesis.
Author

Sheldon McIntyre, CMT
Independent Analyst
Sheldon has 24 years of investment experience holding various positions in companies based in the United States and Chile. His core competencies include BRIC and G-10 equity markets, swing and position trading and technical analysis.


