|

Chiliz Price Forecast: CHZ could crash by 44% in the near term

  • Chiliz price is contained inside a head-and-shoulders pattern on the 4-hour chart.
  • CHZ faces a significant resistance point which stops it from advancing further.
  • The digital asset needs to hold a crucial support level to avoid a massive fall. 

Chiliz price is down by 44% since its all-time high of $0.84 on April 16. The digital asset has experienced massive volatility in the past several weeks after several positive announcements.

Chiliz price must hold crucial support level

On the 4-hour chart, it seems that CHZ has formed a head-and-shoulders pattern with its neckline located at $0.47. A 4-hour candlestick close below this key point would confirm a breakdown of the pattern. 

chz price

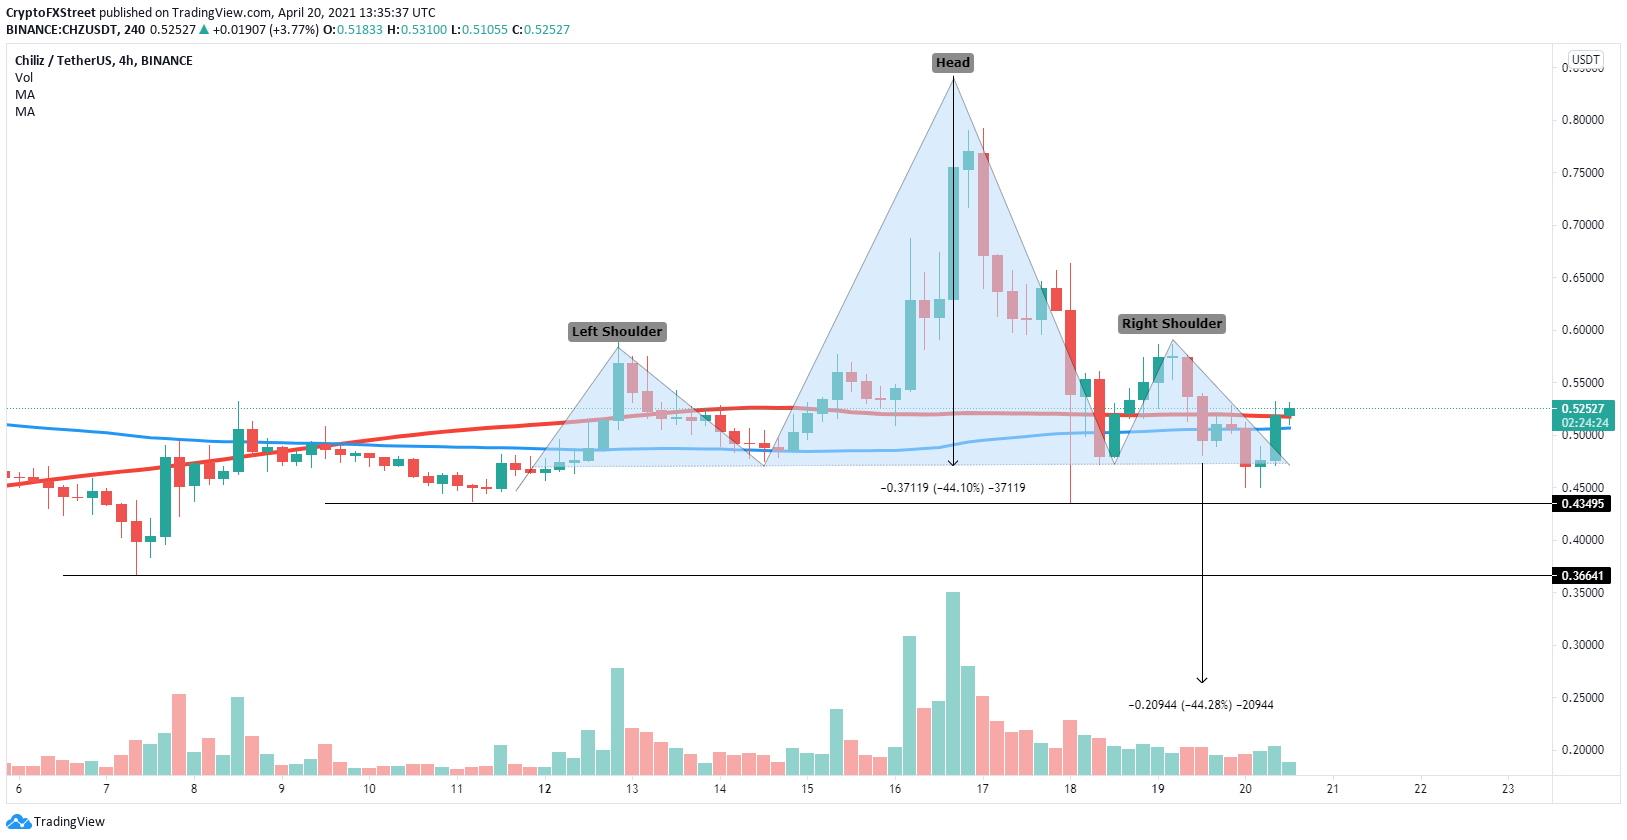
CHZ/USD 4-hour chart

The height of the pattern from the top to the neckline is 44% which would also be the long-term price target of the breakdown. 

There are other price targets on the way, first at $0.435 and the second at $0.366 which are previous lows of CHZ.

The biggest asset of the bulls is the 26 EMA on the daily chart which has held the price for several months.
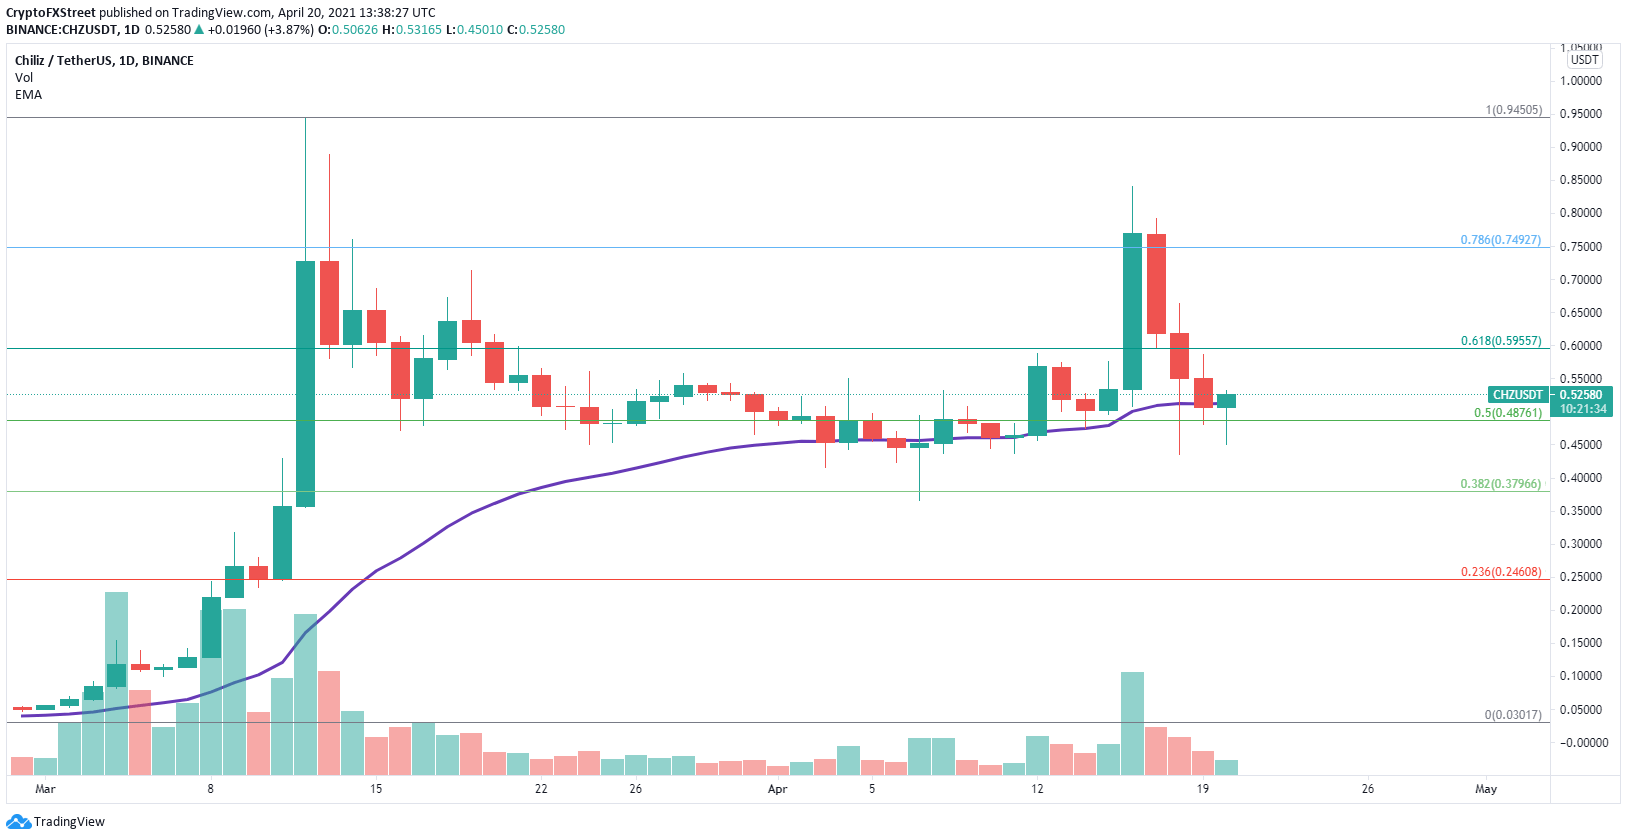
 
chz price

CHZ/USD daily chart

If Chiliz can stay above this key support level, it can quickly shoot up toward $0.60 at the 61.8% Fibonacci retracement level as there isn’t a lot of resistance ahead. 

Author

Lorenzo Stroe

Lorenzo Stroe

Independent Analyst

Lorenzo is an experienced Technical Analyst and Content Writer who has been working in the cryptocurrency industry since 2012. He also has a passion for trading.

More from Lorenzo Stroe
Share:

Editor's Picks

Ripple extends losses as derivatives interest cools

Ripple (XRP) extends its bearish roll near $1.12 support on Friday, reflecting intense headwinds in the broader crypto market largely attributable to macroeconomic pressure.

Crypto Today: Bitcoin, Ethereum, XRP weaken further as capital outflows persist

Macroeconomic headwinds continue to weigh heavily on the cryptocurrency market on Friday, prompting major assets like Bitcoin (BTC) to pare earlier gains and extend losses after June’s brief relief rally.

Bitcoin Weekly Forecast: Recovery hopes fade after the Fed spoils the party

Bitcoin is set to end the week in the red, trading near the 200-Week Simple Moving Average at around $62,300 on Friday. Institutional selling persists, capping BTC’s recovery as spot Exchange Traded Funds point to a sixth consecutive week of outflows.

Sui risks a deeper bearish leg despite on-chain resilience

Sui is down 2% on Friday, extending its decline toward the recent support leg formed at $0.6618. The Total Value Locked in the Sui ecosystem has stabilized around 600 million SUI tokens, reflecting resilient user demand.

Bitcoin: Recovery hopes fade after the Fed spoils the party
Bitcoin (BTC) is set to end the week in the red, trading near the 200-Week Simple Moving Average (SMA) at around $62,300 on Friday. Institutional selling persists, capping BTC’s recovery as spot Exchange Traded Funds (ETFs) point to a sixth consecutive week of outflows.