Chiliz Price Forecast: CHZ bulls wait for no one, target 70% gain
- Chiliz price triggers bullish flag continuation pattern this week.
- CHZ partners with Rakuten Europe to enable their customers to use points to redeem Fan Tokens.
- Last week’s low is the line in the sand.

Chiliz price confirmed a breakout from the flag pattern on April 12 and is poised for notable gains moving forward. Speculators will find some resistance at key Fibonacci levels, but the all-time high of $0.976 is in the crosshairs.
Chiliz price reset put momentum indicators in line for a new rally
The CHZ shakeout below the flag’s lower trend line last week and the successful rebound from the 61.8% retracement of the flag pole raised the odds of a bullish resolution for the continuation pattern, and more importantly, provided a timely entry point for speculators. On April 12, the CHZ flag pattern confirmed the upside resolution after triggering last week’s high at $0.540.
A steep, sharp price trend precedes flag patterns, and in the case of CHZ, the February-March rally leg reached over 3000%. Extensive work shows that flag patterns preceded by a rally of at least 90% have almost zero failure rate and yield an average return of 70%. Volume should decline during formation, as it did in the case of the digital asset.
The slight pullback over the last two days does nothing to diminish the breakout’s integrity for speculators and should be used as a buying opportunity.
On the upside, there is some congestion at the 50% and 61.8% retracements levels of the March correction at $0.670 and $0.742, respectively. The 70% target is at $0.914, but the magnet effect of the all-time high of $0.976 should pull CHZ higher.
Once in new highs, the 161.8% extension of the March decline at $1.353 is the primary target.
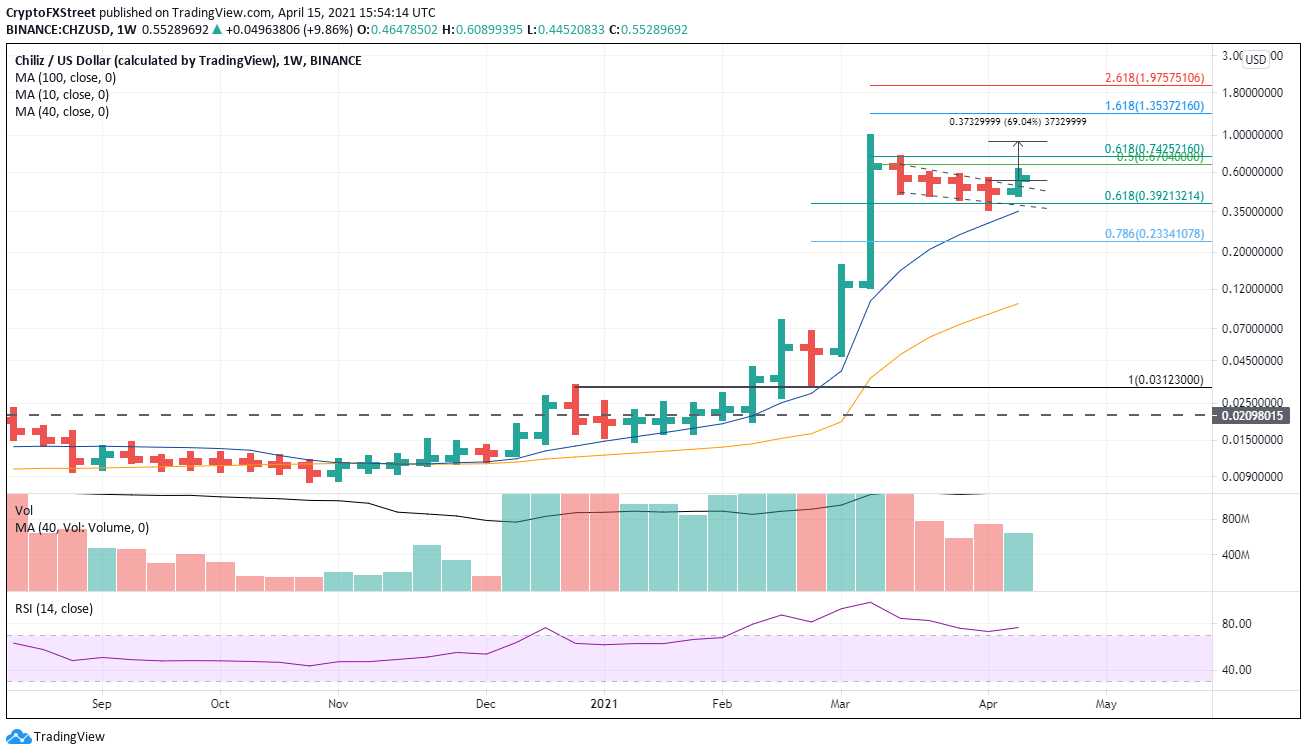
CHZ/USD weekly chart
A breakdown below last week’s low of $0.364 will quickly lead to a test of the 10-week simple moving average at $0.352. If selling accelerates, speculators will likely drive CHZ down to the 78.6% retracement of the flag pole rally leg at $0.233.
Author

Sheldon McIntyre, CMT
Independent Analyst
Sheldon has 24 years of investment experience holding various positions in companies based in the United States and Chile. His core competencies include BRIC and G-10 equity markets, swing and position trading and technical analysis.



