Chiliz price excitement fades as CHZ hodlers show zero conviction
- Chiliz price burst over the European Cup proves short-lived as it failed to overcome a trifecta of resistance.
- CHZ 200-day simple moving average (SMA) remains instructive for pullbacks, but a failure to hold forecasts big problems.
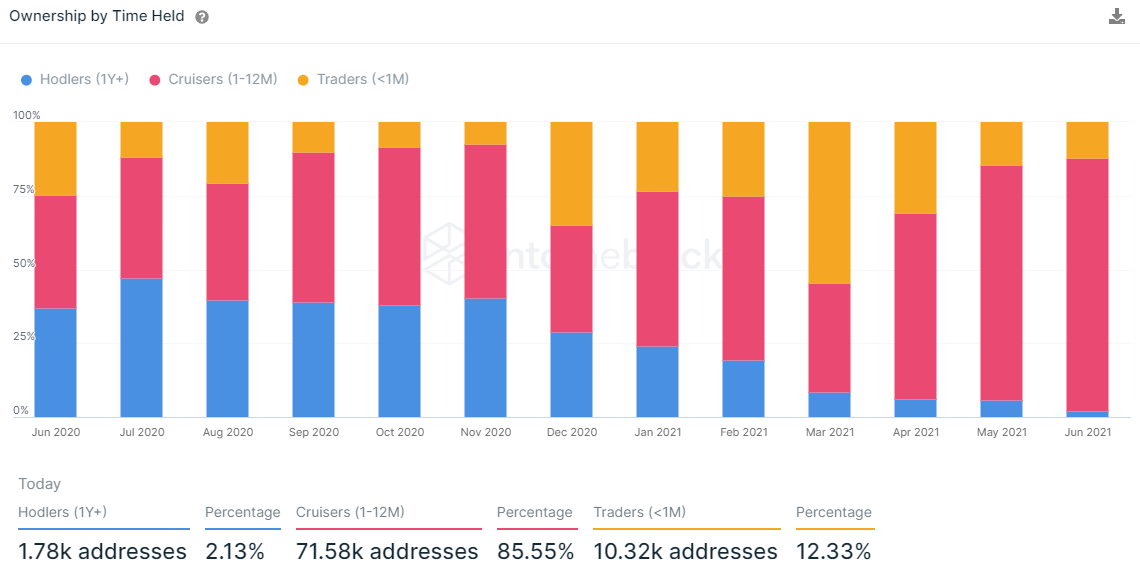
- According to the IntoTheBlock Ownership by Time Held data, Chiliz owners of at least a year represent just 2% of the total ownership.

Chiliz price climbed just over 70% from the June 9 low to the May 11 high in the run-up to the kick-off of the European Cup, one of the premier soccer events in the world. The notable rally did capture the attention of the cryptocurrency markets and the CHZ faithful, but it has since stumbled lower. Currently, a trifecta of resistance and a lack of hodler conviction amps the skepticism over a bullish outlook for the sports & entertainment token.
Chiliz price dictated by the short-term players chasing minor swings
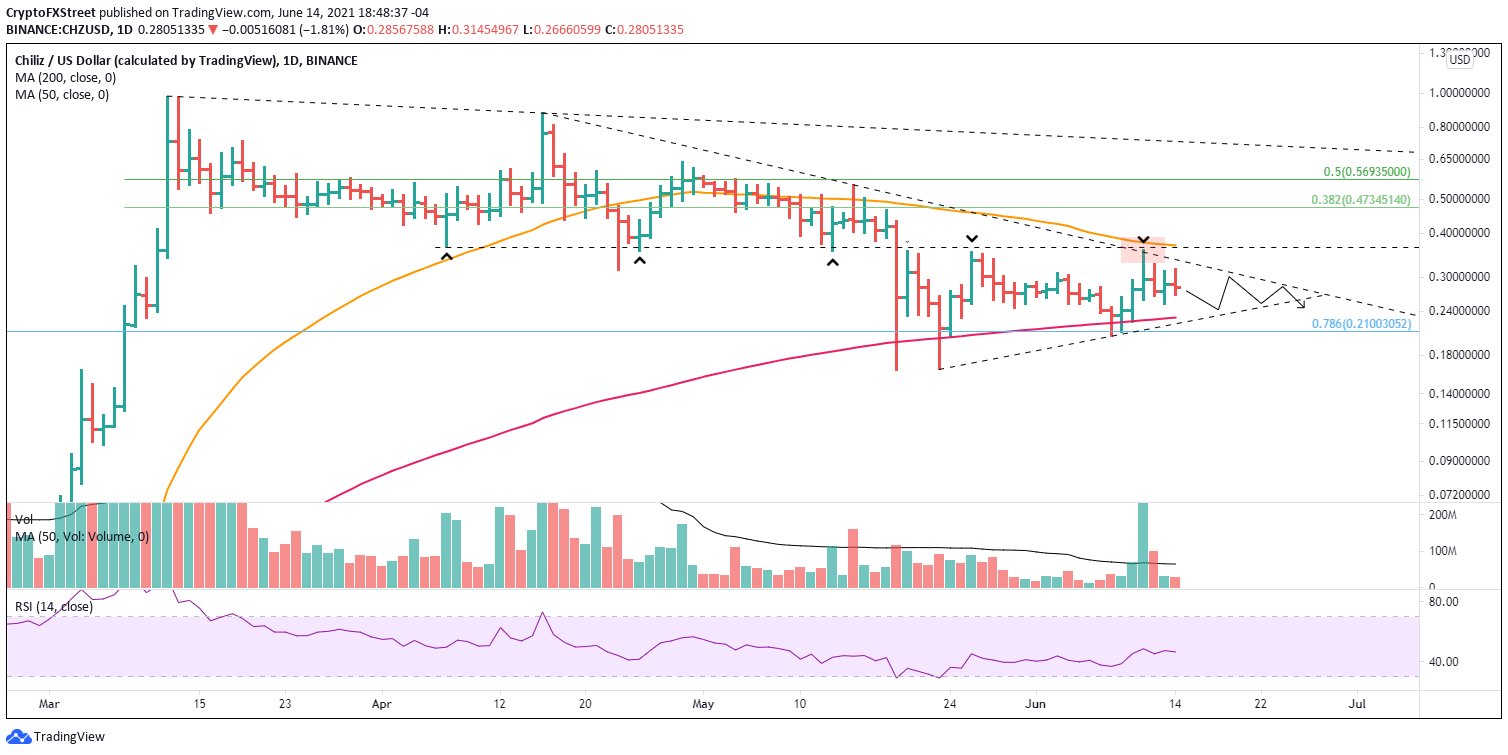
Chiliz price crashed over 80% from the March 12 high of $0.975 to the May 19 low of $0.163, and it was highlighted by a 60% drop on May 19. Yes, CHZ did rebound over 100% from May low to the May 20 high of $0.356, but it failed to conquer resistance designated by the April 7 low of $0.364.
Due to the hype surrounding the European Cup, CHZ once again rallied towards $0.364 but failed to overcome the level, succumbing to a trifecta of resistance framed by it, the April declining trend line and the intimidating 50-day SMA.
Chiliz price fumbled the opportunity presented by the European Cup and has shifted into a range sandwiched by the April declining trend line and the 200-day SMA. It is conceivable that CHZ will sustain the range until it reaches an apex formed by the declining trend line and the May 23 rising trend line.
Considering the failed attempt to break out, a daily close below the 200-day SMA at $0.230 and the May 23 rising trend line at $0.219 should point to a new leg lower for Chiliz price. A close below the June 8 low of $0.204 will confirm and prompt CHZ to quickly sweep the May 19 and 23 lows around $0.163, generating a 40% loss from the current price.
CHZ/USD daily chart
Until Chiliz price can capture $0.364, it is challenging to promote a bullish scenario.
In July 2020, hodlers (held CHZ for more than a year) represented 47.18% of the ownership, according to IntoTheBlock. Today, hodlers represent just 2.13% of the ownership after beginning a nosedive in December 2020. Hodlers capitalized on the rally into the March high to liquidate positions. Still, they continued dumping during the correction that followed, showing no investment conviction in the digital asset.
Today, almost 98% of the CHZ ownership has held the token for less than a year, and 12.33% have owned it less than a month. As a result, there is limited underlying conviction in CHZ as determined by the current ownership profile. At best, market operators should expect volatility and brief bounces to be sold. They should also be aware that there could be no support if Chiliz price returns to a downward trajectory.
CHZ Ownership by Time Held - IntoTheBlock
CHZ is an interesting project that stirs up tremendous enthusiasm among sports fanatics. Still, since March, Chiliz price and the investment decisions of hodlers have not conveyed a bullish view. With the price structure still questionable, there is no reason to tempt portfolio losses until the key resistance levels mentioned above are defeated.
Author

Sheldon McIntyre, CMT
Independent Analyst
Sheldon has 24 years of investment experience holding various positions in companies based in the United States and Chile. His core competencies include BRIC and G-10 equity markets, swing and position trading and technical analysis.