|

Chiliz Price Analysis: CHZ not commanding a bullish audience yet

  • Chiliz price trading steadily along the 21-day simple moving average (SMA).
  • Descending channel breakout on March 27 lacked conviction from the bulls.
  • Notable downside awaits if the current price range does not hold.

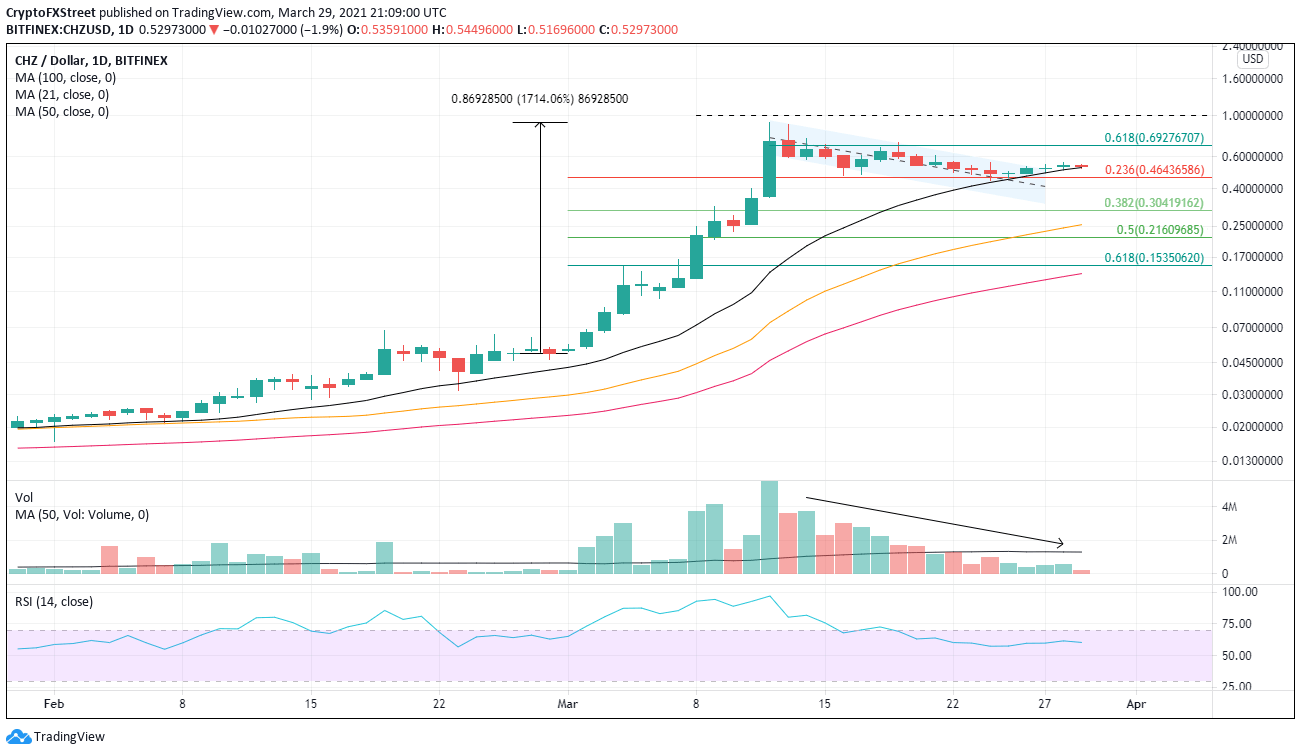
Chiliz price locked in an incredible month with a 1700% gain by March 12. Over the second half of the month, the altcoin has corrected 52% at the most recent low. It is a reminder that trafficking in cryptocurrencies requires a unique discipline and clear profit targets based on historical precedent analysis. Nevertheless, it can be argued that CHZ is not out of the woods, and the pause in the decline could be fragile if renewed selling hits the broader market.

Chiliz price not responding to bullish technical catalyst

From the March 12 high until March 27, CHZ declined within a descending channel, with price holding the midline most of the time. Since the channel’s breakout on March 27, the cryptocurrency has not captured buyers’ interest. Instead, it has simply drifted along the 21-day SMA on meager volume. As a result, the price action has not reconciled the near-term outlook and keeps the risk tilted to the downside.

As mentioned above, the 21-day SMA is in play at $0.523, and the 0.236 Fibonacci retracement level of the March rally strengthens the price area, as it rests just below $0.464. After that, the 50-day SMA is at $0.225, representing an enormous decline of 50% from today’s price unless the 0.382 retracement level at $0.304 can halt the slide.
CHZ/USD daily chart

CHZ/USD daily chart

The bullish spirits may return on a daily close above $0.559, opening the path to the 0.618 Fibonacci retracement at $0.693. The retracement level corresponds closely to the March 15 high at $0.700 and the March 19 high at $0.712 and will prove to be a defiant resistance level.

Author

Sheldon McIntyre, CMT

Sheldon McIntyre, CMT

Independent Analyst

Sheldon has 24 years of investment experience holding various positions in companies based in the United States and Chile. His core competencies include BRIC and G-10 equity markets, swing and position trading and technical analysis.


More from Sheldon McIntyre, CMT
Share:

Editor's Picks

Cardano Price Forecast: ADA extends gains after Mastercard deal, Leios testing

Cardano price extends a steady near-term recovery on Monday, inching closer to the long-term 200-day EMA near $0.2464. The recent partnership with Mastercard and the Leios upgrade testing lift ADA investors' spirits. The technical outlook for ADA shows an upside bias as bullish momentum recovers.

Crypto Overview: Bitcoin reclaims $80,000 – Venice Token and NEAR Protocol rally

Bitcoin is trading above $81,000 holding firm after a 6% surge on Friday, linked to US financial watchdogs' efforts to structure crypto assets under existing rules following the CLARITY Act's failure to advance. Venice and NEAR Protocol have posted double-digit gains over the last 24 hours, scaling to fresh annual highs.

Top 3 Price Prediction: BTC extends gains, ETH and XRP advance in uptrend

Bitcoin, Ethereum, and Ripple extend their gains after posting strong gains of over 5%, 6% and 5%, respectively, last week. BTC trades above $81,300, ETH climbs above $2,600, and XRP holds above the key $1.300 support level. All three momentum indicators suggest early bullish momentum and hint at further gains ahead.

Bitcoin pushes above $81K, faces liquidation test between $83K and $86K
Bitcoin (BTC) rose above $81,000 on Friday after climbing back above the True Market Mean, signaling that the market could potentially have moved back into a bullish regime. The True Market Mean, at $76,660, represents the average price paid by active trading participants. BTC’s move back above the level often signals a return to bullish territory and can trigger positive short-term sentiment.
Bitcoin: BTC shrugs off CLARITY Act setback and hawkish Fed
Bitcoin (BTC) price action has remained resilient this week, trading above $78,000 at the time of writing on Friday, heading toward a key resistance zone. Institutional demand shows early signs of weakness, with spot Exchange Traded Funds (ETFs) on track for a second straight week of outflows, with over $420 million recorded through Thursday amid escalating Middle East tensions.


