Chainlink price pursues buy signal today, here’s where LINK goes next
- Chainlink price lays a bear trap, rallies 19% over the last four days.
- LINK 2018 uptrend remains active after successful tests on July 20 and 21.
- May’s descending trend line muddles today’s attempt to build on the new rally.
-637336005550289133.jpg)
Chainlink price is up 6% this week and carries a 16% loss for July, despite the four-day rally of almost 20%. Today’s attempt to breakout from May’s descending trend line is being subverted by LINK investors capitalizing on the rebound to cut or liquidate positions. How the cryptocurrency closes today will have ramifications for the outlook moving forward.
Chainlink price has not reached a secure position to release the bulls
The Chainlink price gain of nearly 20% over the last four days marks the best return over a four-day period since the beginning of June, pointing to some impulsiveness behind the LINK rebound. Diminishing the importance of the bounce is the weak underlying volume, with only July 21 showing above-average volume.
Moving forward, to encourage the bullish LINK speculators and forecasts, Chainlink price needs to record a daily close above May’s descending trend line, currently at $16.27. It would be the first confirmation of the rally from the support granted by the dominant 2018 ascending trendline on July 20 and 21.
Assuming a bullish close, Chainlink price will face no opposition until the 50-day simple moving average (SMA) at $19.42, followed by the 2020 high of $20.00 and then the July 7 high of $21.27, generating a 30% return from the May descending trend line. A break above $21.27 would also trigger a larger double bottom pattern framed by the June 22 low of $15.00 and the July 20 low of $13.38.
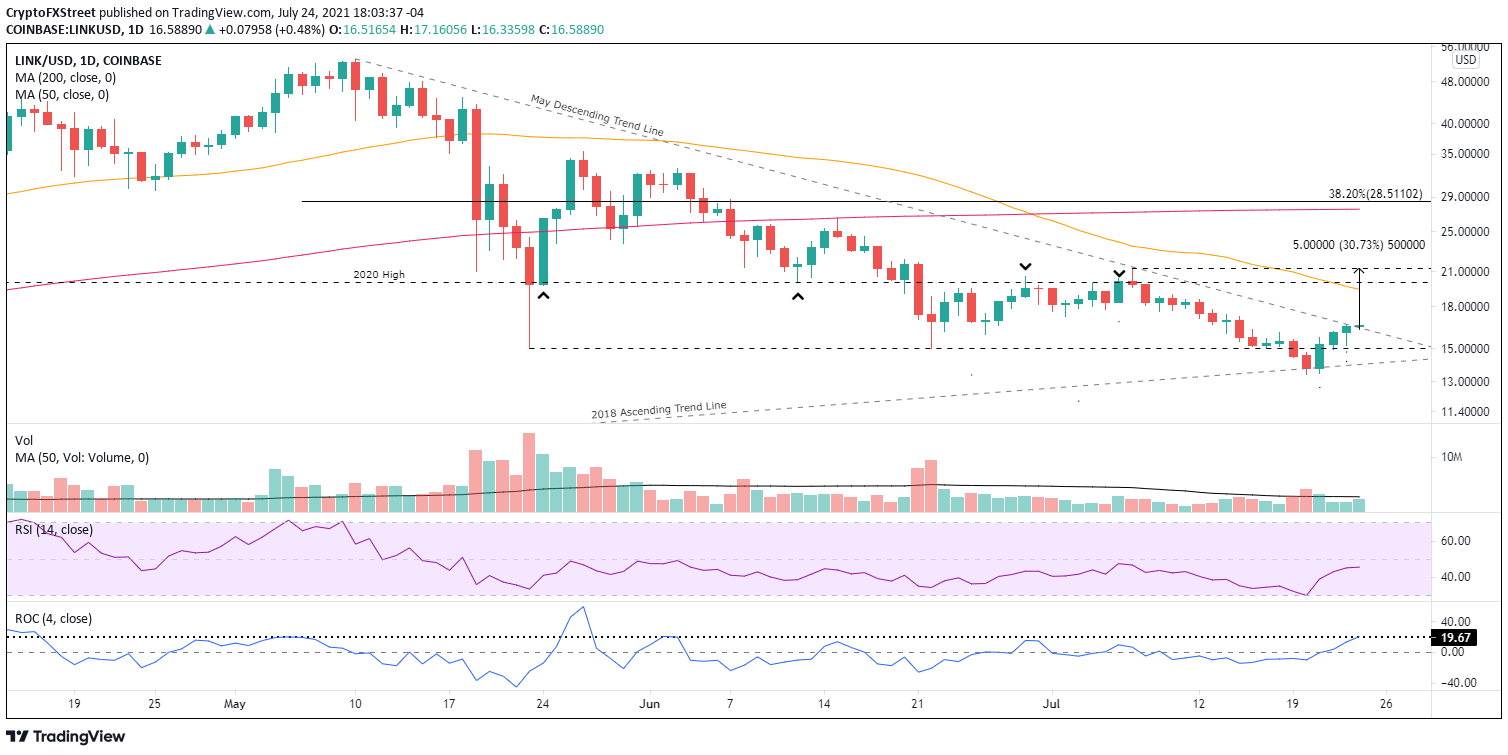
LINK/USD daily chart
Downside support begins with the May 23 and June 22 lows at $15.00, followed by the 2018 ascending trend line, currently at $14.06. A failure to hold the trend line places Chainlink price in a complicated situation with no recognizable support until the December 2020 low of $8.72. An extremely bearish outcome for LINK, but a low probability.
Chainlink price laid the perfect bear trap, using a small gap between the presiding support at $15.00 and the secondary support at the 2018 ascending trendline to mislead the weak holders, proving the inherent value of studying longer timeframes.
Despite the bounce from the bear trap, LINK has not accomplished anything from a macro perspective. It is well below the 50-week SMA at $21.22 and the 200-day SMA at $27.55, writing a challenging story for Chainlink price if a sustainable bid emerges.
For the moment, be a spectator, let Chainlink price prove itself by closing above the May descending trend line and then proceed to accumulate a position with an eye on the LINK price targets discussed above. However, do not overlook the influential support levels if weakness emerges.
Here, FXStreet's analysts evaluate where LINK could be heading next as on-chain metrics turn bullish.
Author

Sheldon McIntyre, CMT
Independent Analyst
Sheldon has 24 years of investment experience holding various positions in companies based in the United States and Chile. His core competencies include BRIC and G-10 equity markets, swing and position trading and technical analysis.


