Chainlink Price Forecast: LINK leans lower, but bearish resolve losing intensity
- Chainlink price triggers a bear flag pattern on July 8 that yields a 14% decline as of today’s low.
- LINK 14-day Average True Range (ATR) indicator now at the lowest level since the beginning of 2021.
- The May 23 and June 22 lows combine to provide substantial support if the decline continues.
-637336005550289133.jpg)
Chainlink price has been in a steep dive since the May high, intervened by a brief spike from the May 23 low. The renewal of the downtrend following the breakdown from the bear flag pattern positions LINK for lower prices. Still, outstanding support at $15.00 and interference from ebbing bearish intent will determine the magnitude of the decline moving forward.
Chainlink price direction remains under the control of the bears, for now
The Average True Range (ATR) is not a directional indicator but a volatility indicator that conveys the magnitude of interest in a price move. Impulsive moves, up or down, are frequently accompanied by large ranges or large True Ranges. Corrective moves usually equate into relatively narrow ranges, implying a waning enthusiasm underpinning a price move or breakout. Thus, a bullish reversal with a jump in ATR demonstrates emotion and commitment, thereby raising the profile of the price action. Meanwhile, a bearish reversal with an increase in ATR reveals a stampede for the exits and confirms the move.
In the case of Chainlink price, the 14-day ATR has been trending lower since the milestone high following the May collapse, showing a gradual decline in the bearish sentiment behind the weaker price. In fact, the LINK ATR reading is at the same level as the beginning of 2021 and raises the probability of at least marginal rebound in the coming days or weeks.
Nevertheless, the guiding price structure for LINK is the decline from the bear flag pattern with two measured move price targets. The first is the pattern trough at $15.00, yielding a 20% dip, or $10.89, representing a 40% decline from the pattern entry price. The 40% move is measured from the flag’s trough to high.
Chainlink price can avert the mentioned scenarios with a daily close above $19.00. It would position LINK for a test of the declining 50-day simple moving average (SMA) at $22.34 where the weight of the bearish Death Cross pattern, triggered on June 30, should freeze the rally and introduce some form of consolidation. Even so, it will reward LINK speculators with an 18% gain from $19.00.
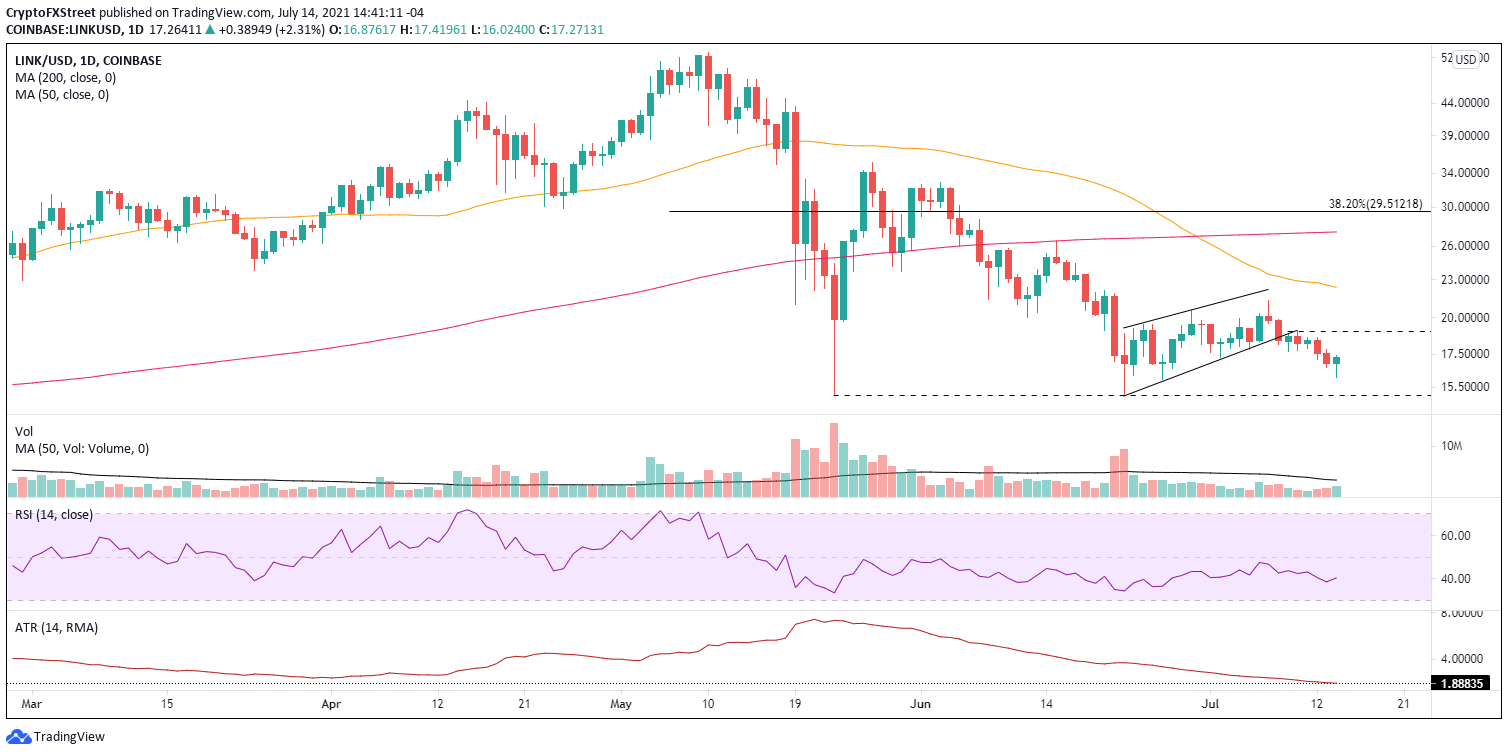
LINK/USD daily chart
Suppose Chainlink price becomes inspired by a more robust cryptocurrency complex. In that case, it may overcome the 50-day SMA and target the flattening 200-day SMA at $27.40. Still, it would need to be complemented by a spike in LINK volume to achieve the sustainability necessary to climb another five points.
The notable compression in volatility exemplified by the falling 14-day ATR argues that the bearish intensity driving the correction is abating. As a result, Chainlink price could be easily motivated to reverse the current decline from the bear flag pattern. However, until LINK can recover $19.00 on a daily closing basis, the digital asset is directed by the bearish tone established by the prevailing pattern.
Author

Sheldon McIntyre, CMT
Independent Analyst
Sheldon has 24 years of investment experience holding various positions in companies based in the United States and Chile. His core competencies include BRIC and G-10 equity markets, swing and position trading and technical analysis.


