Chainlink Price Prediction: LINK is on the verge of a 30% breakout
- Chainlink price has concluded a consolidation period, hinting at another rally to new record highs.
- LINK's decisive breakout from an ascending triangle shows a quick 30% surge ahead.
- On-chain metrics reveal a strong support barrier adding credence to the bullish thesis.
-637336005550289133.jpg)
Chainlink price has seen a steady increase in its market value since late September 2020 and picked up the pace in early January 2021. With over 150% year-to-date returns, the decentralized oracle token seems primed for more upside momentum in the near future.
Chainlink price primed to climb to new highs
On February 5, Chainlink price broke out of the ascending triangle on the 4-hour chart. The continuation pattern projects a nearly 30% upswing when taking into consideration the height of its y-axis.
If validated by a spike in demand around the current price levels, Chainlink could surge towards $32.65.
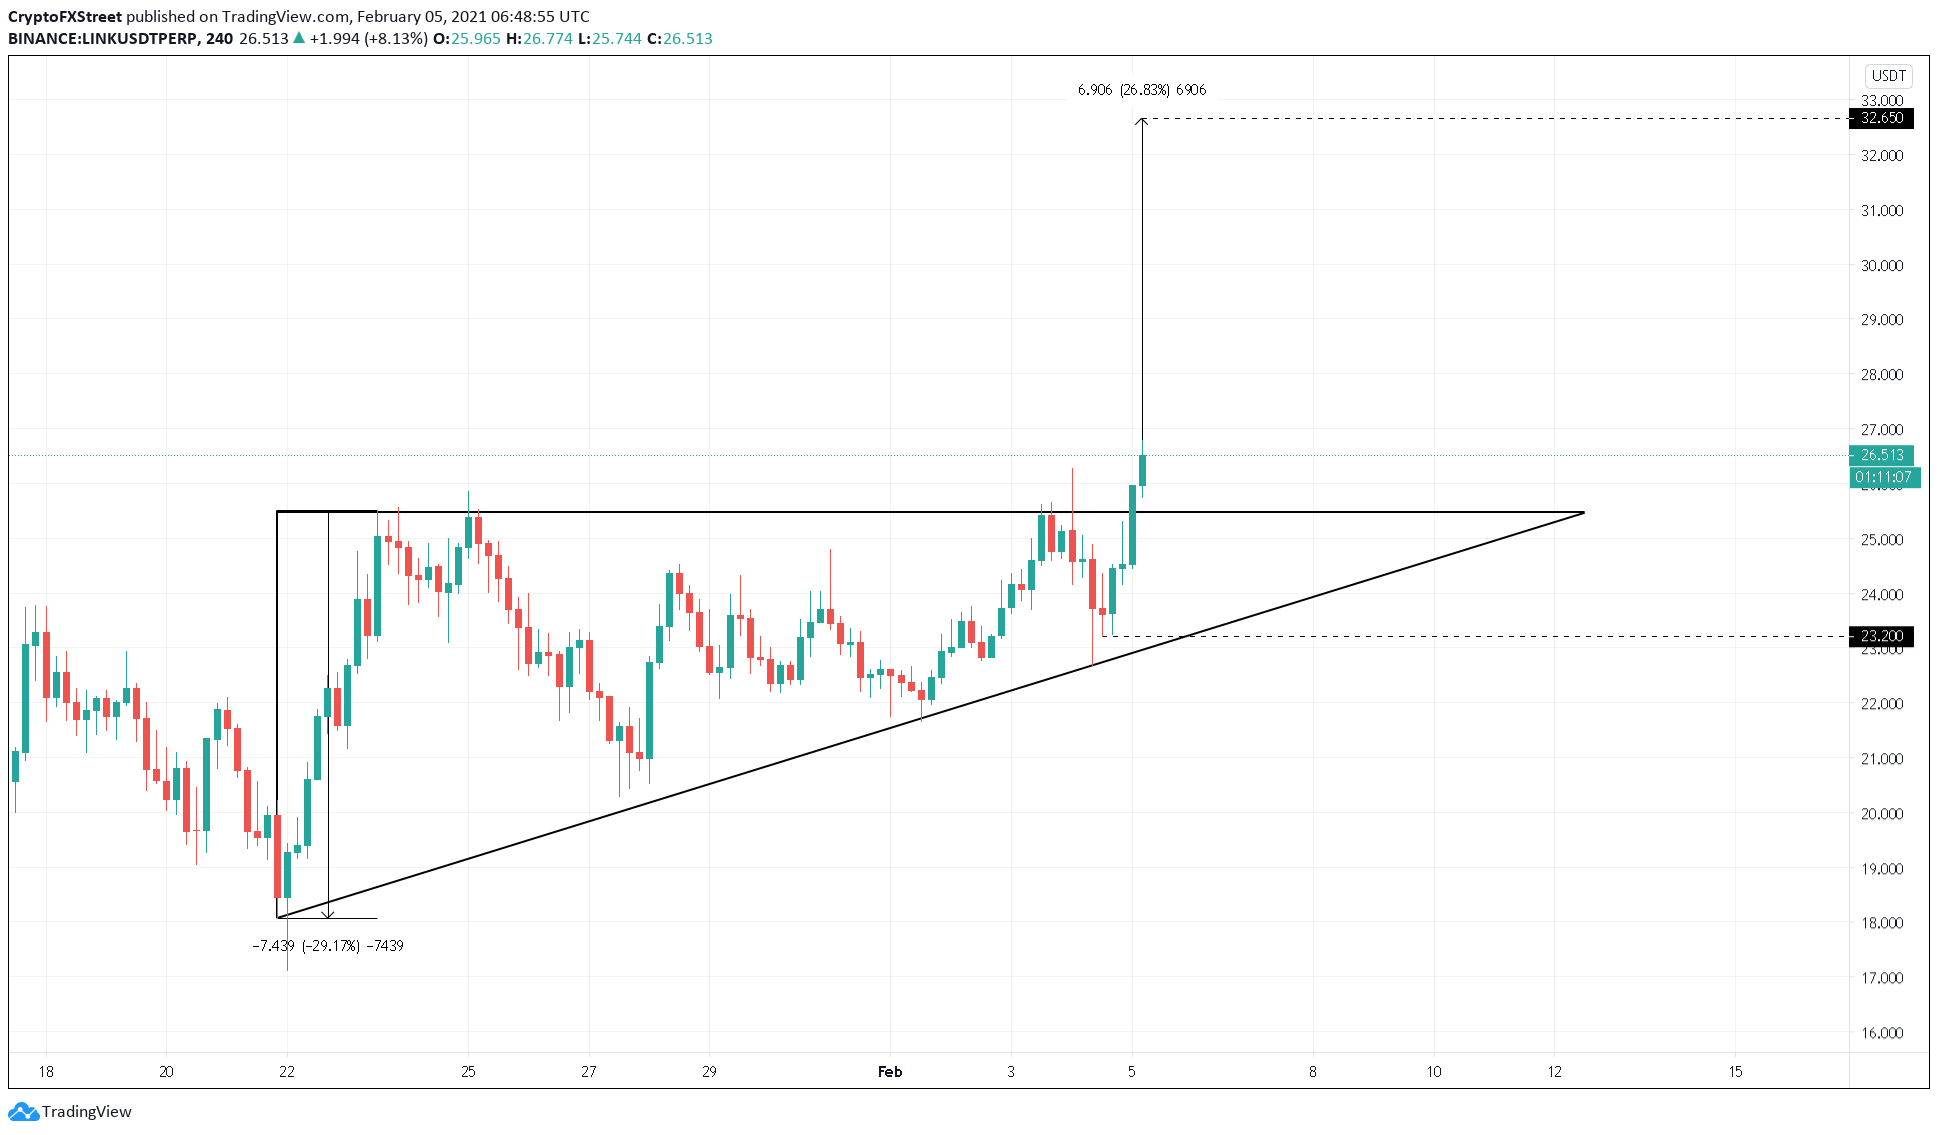
LINK/USDT 4-hour chart
IntoTheBlock's In/Out of the Money Around Price (IOMAP) model shows that since Chainlink is in price discovery mode, it faces no opposition ahead that will prevent it from reaching the ascending triangle’s target. Instead, it sits on top of an intense concentration of holders.
Based on this on-chain metric, more than 20,200 addresses purchased around 18 million LINK at an average price of $23.30. Such a massive demand zone may have the ability to contain any downward pressure, especially because it coincides with the ascending triangle's hypotenuse.
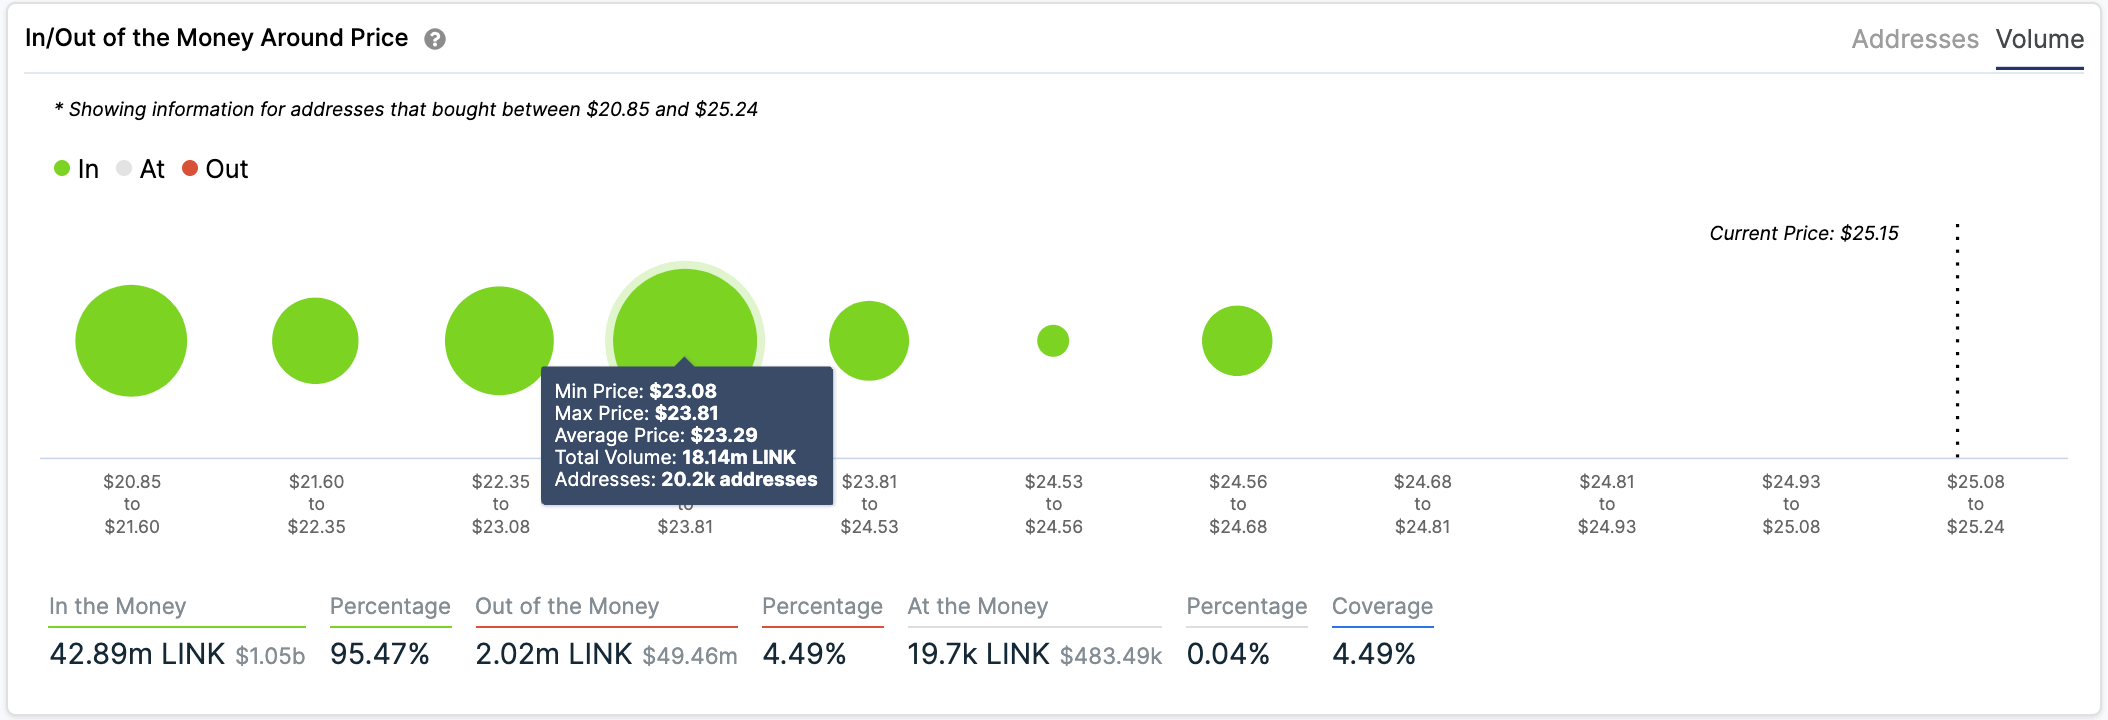
LINK IOMAP chart
Only a 4-hour candlestick close below this support level will invalidate the bullish outlook and lead to a downswing that pushes Chainlink price towards $17. But doing so will not be easy for the bears, given the strengthening fundamentals behind it.
Development activity skyrockets
While Chainlink aims for higher highs, the team behind it has been working to improve the network and expand its utility. Today, Chainlink's Price Reference Data Feeds are among the most widely used decentralized oracle solutions in the nascent DeFi space.
For this reason, the blockchain startup recently announced the launch of an on-chain data directory using Ethereum Name Service (ENS). The move is intended to “provide users with additional assurances that they are relying on and/or sending funds to the right on-chain address.”
Chainlink’s commitment to improve and polish its decentralized oracles solution services, and upgrade its features can be seen on Santiment’s Development Activity chart.
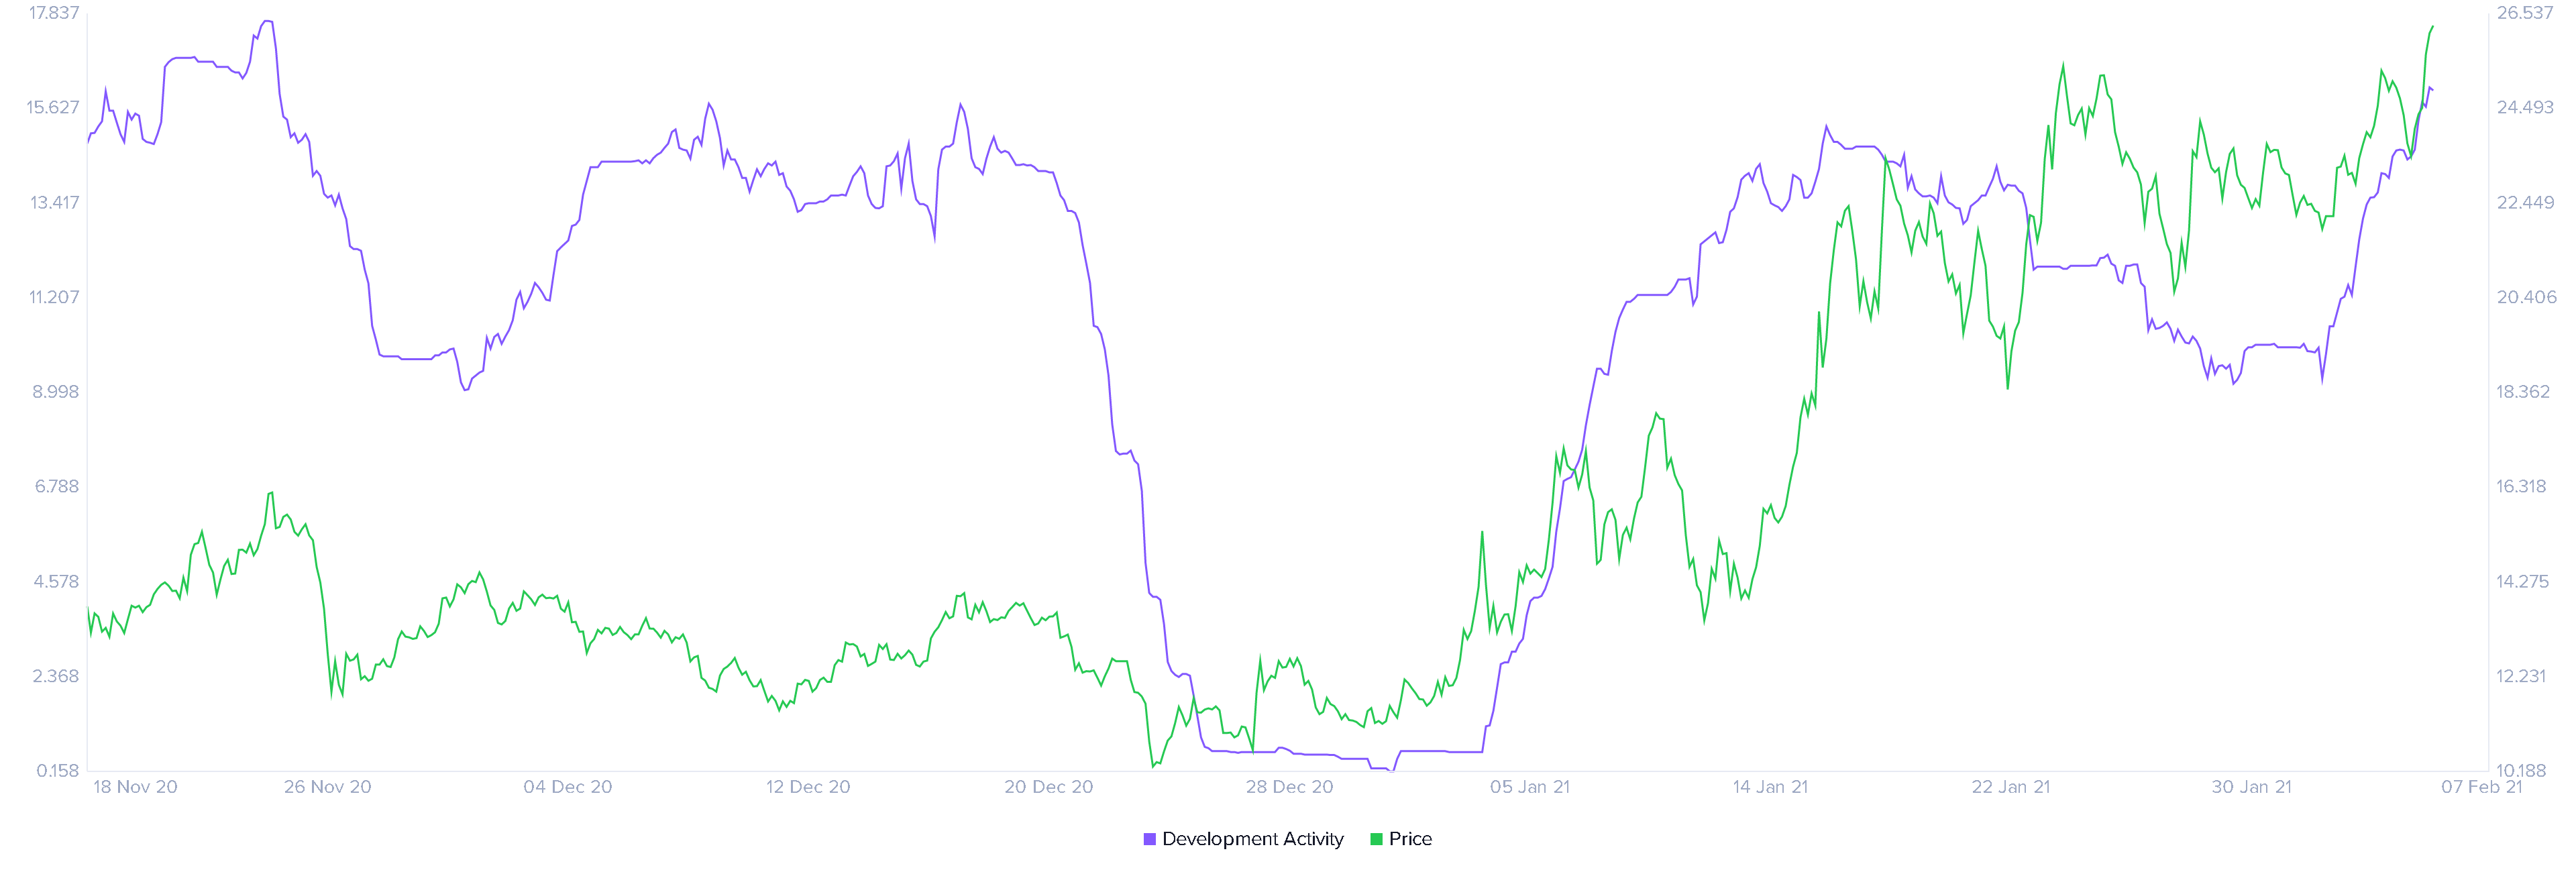
Link Development Activity chart
Usually, spikes development activity occur before Chainlink releases an upgrade or new service. Speculators tend to take advantage of this on-chain metric to anticipate major announcements and profit from a potential increase in volatility.
For example, Chainlink price rose by 16% after development activity surged by 33% between January 10 and January 19 of the present year. This on-chain metric has now experienced a 72% upswing over the past week.
If history repeats itself, LINK could easily reach the ascending triangle’s target of $32.65.
Author

Akash Girimath
FXStreet
Akash Girimath is a Mechanical Engineer interested in the chaos of the financial markets. Trying to make sense of this convoluted yet fascinating space, he switched his engineering job to become a crypto reporter and analyst.