|

Chainlink Price Prediction: LINK technical pattern nearing breaking point, colossal 25% move looms

  • Chainlink price is contained inside a symmetrical triangle pattern on the 4-hour chart.
  • LINK is on the verge of a massive 25% move that might favor the bears.
  • A key indicator has presented a sell signal on the daily chart, giving the upper hand to the sellers.

Chainlink has been trading sideways for the past two days after establishing a new all-time high at $35.69. Now, LINK has formed a symmetrical triangle pattern which is on the verge of bursting.

Chainlink price can quickly fall towards $25

On the 4-hour chart, the symmetrical triangle formed by Chainlink is on the verge of a breakout or breakdown. The current price at $32.4 is closer to the support trendline formed at $32. Losing this critical point can lead to a significant 25% drop towards $25. 

link price

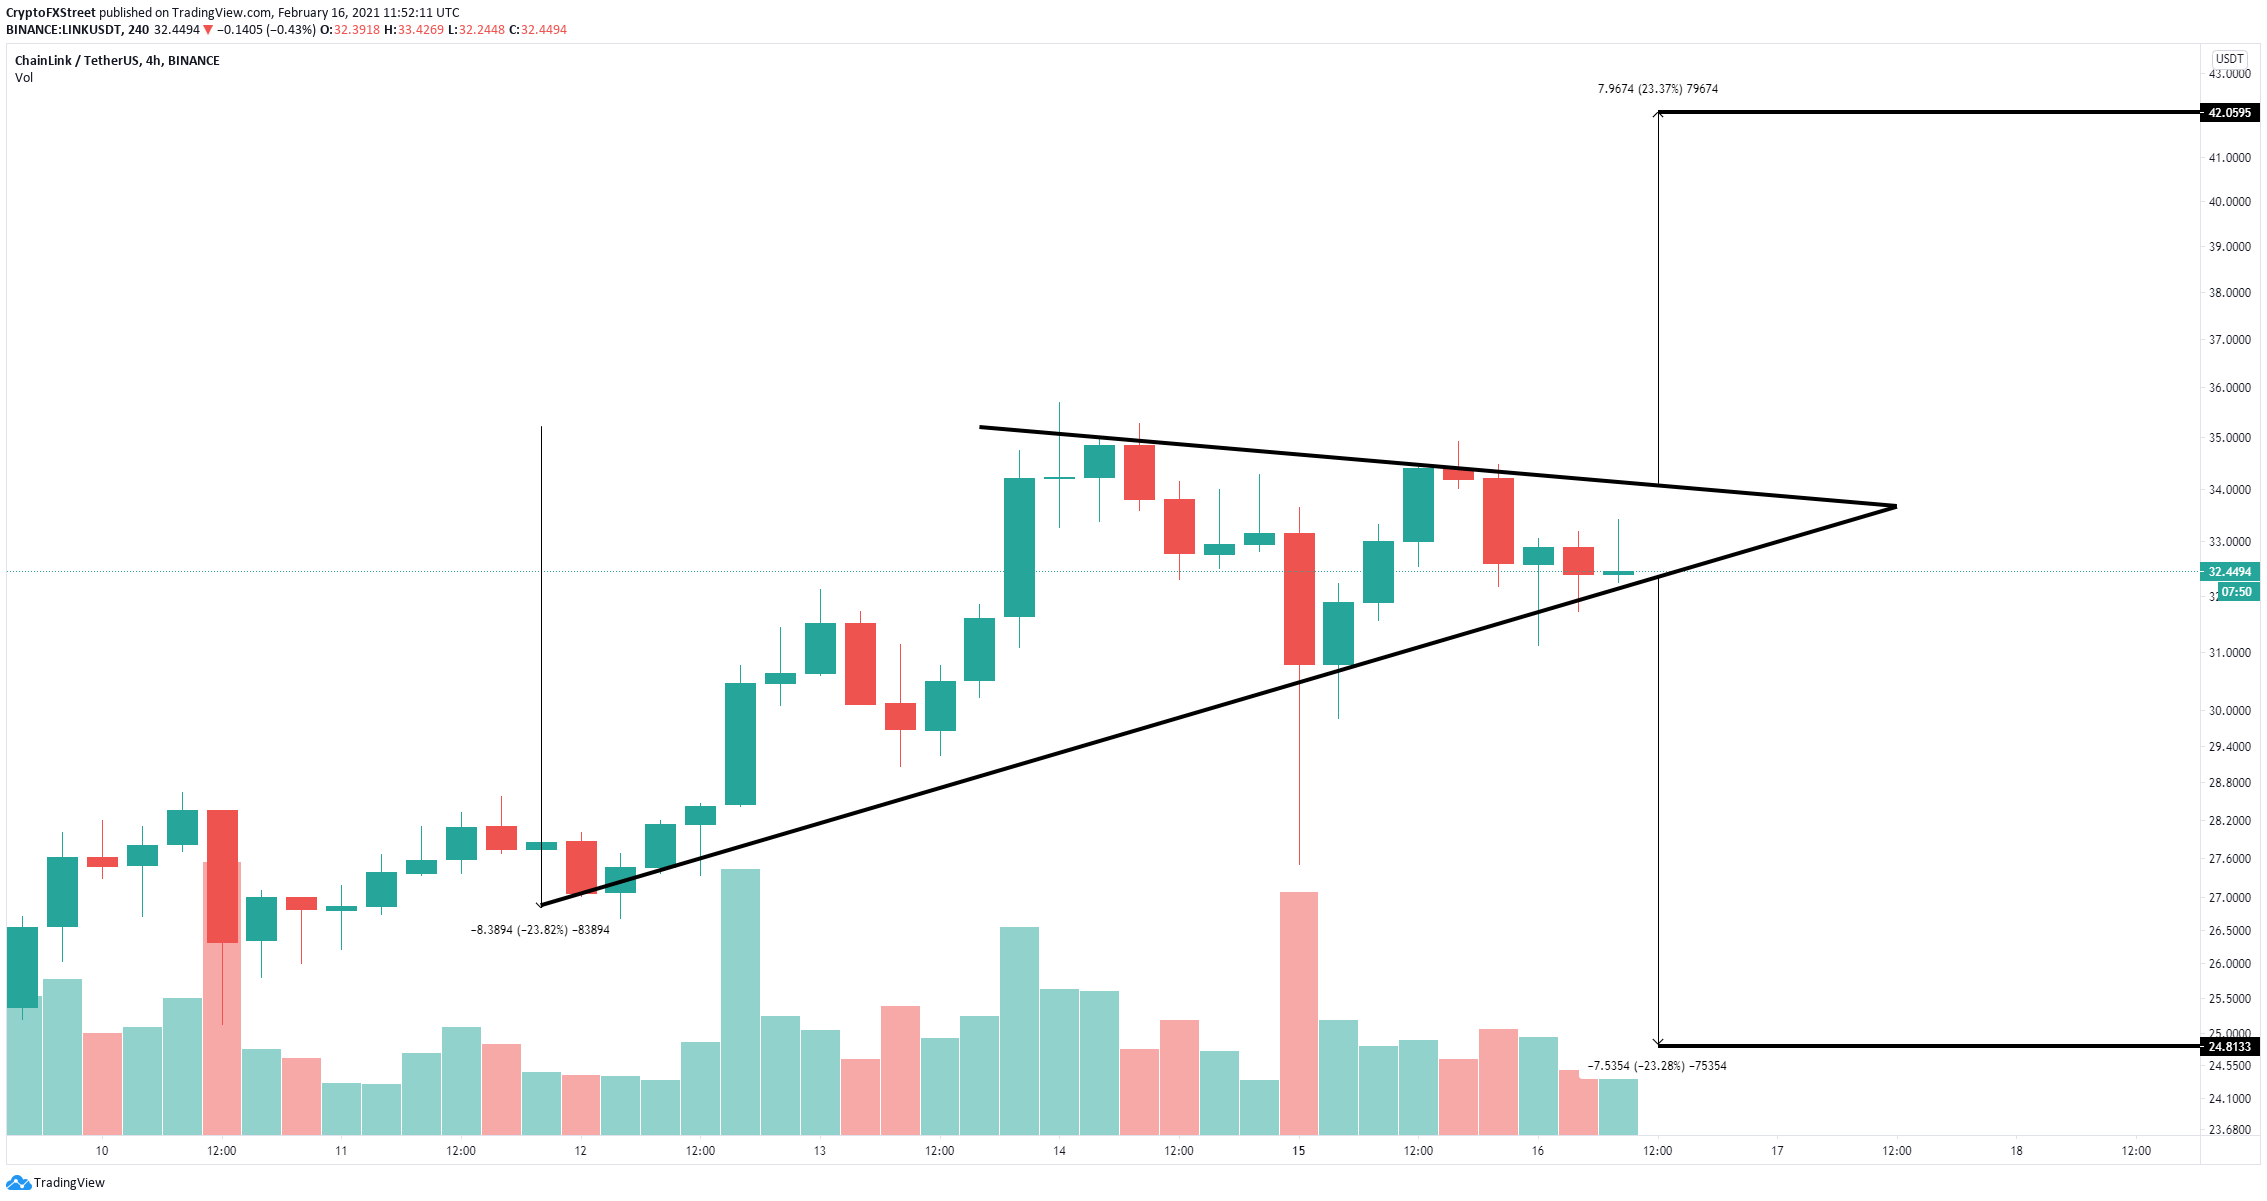
LINK/USD 4-hour chart

The bears have the upper hand as the TD Sequential indicator has just presented a sell signal on the daily chart. In the past, this call has proven to be extremely accurate leading to 30-40% corrections within a week after it the signals were presented. 

link price

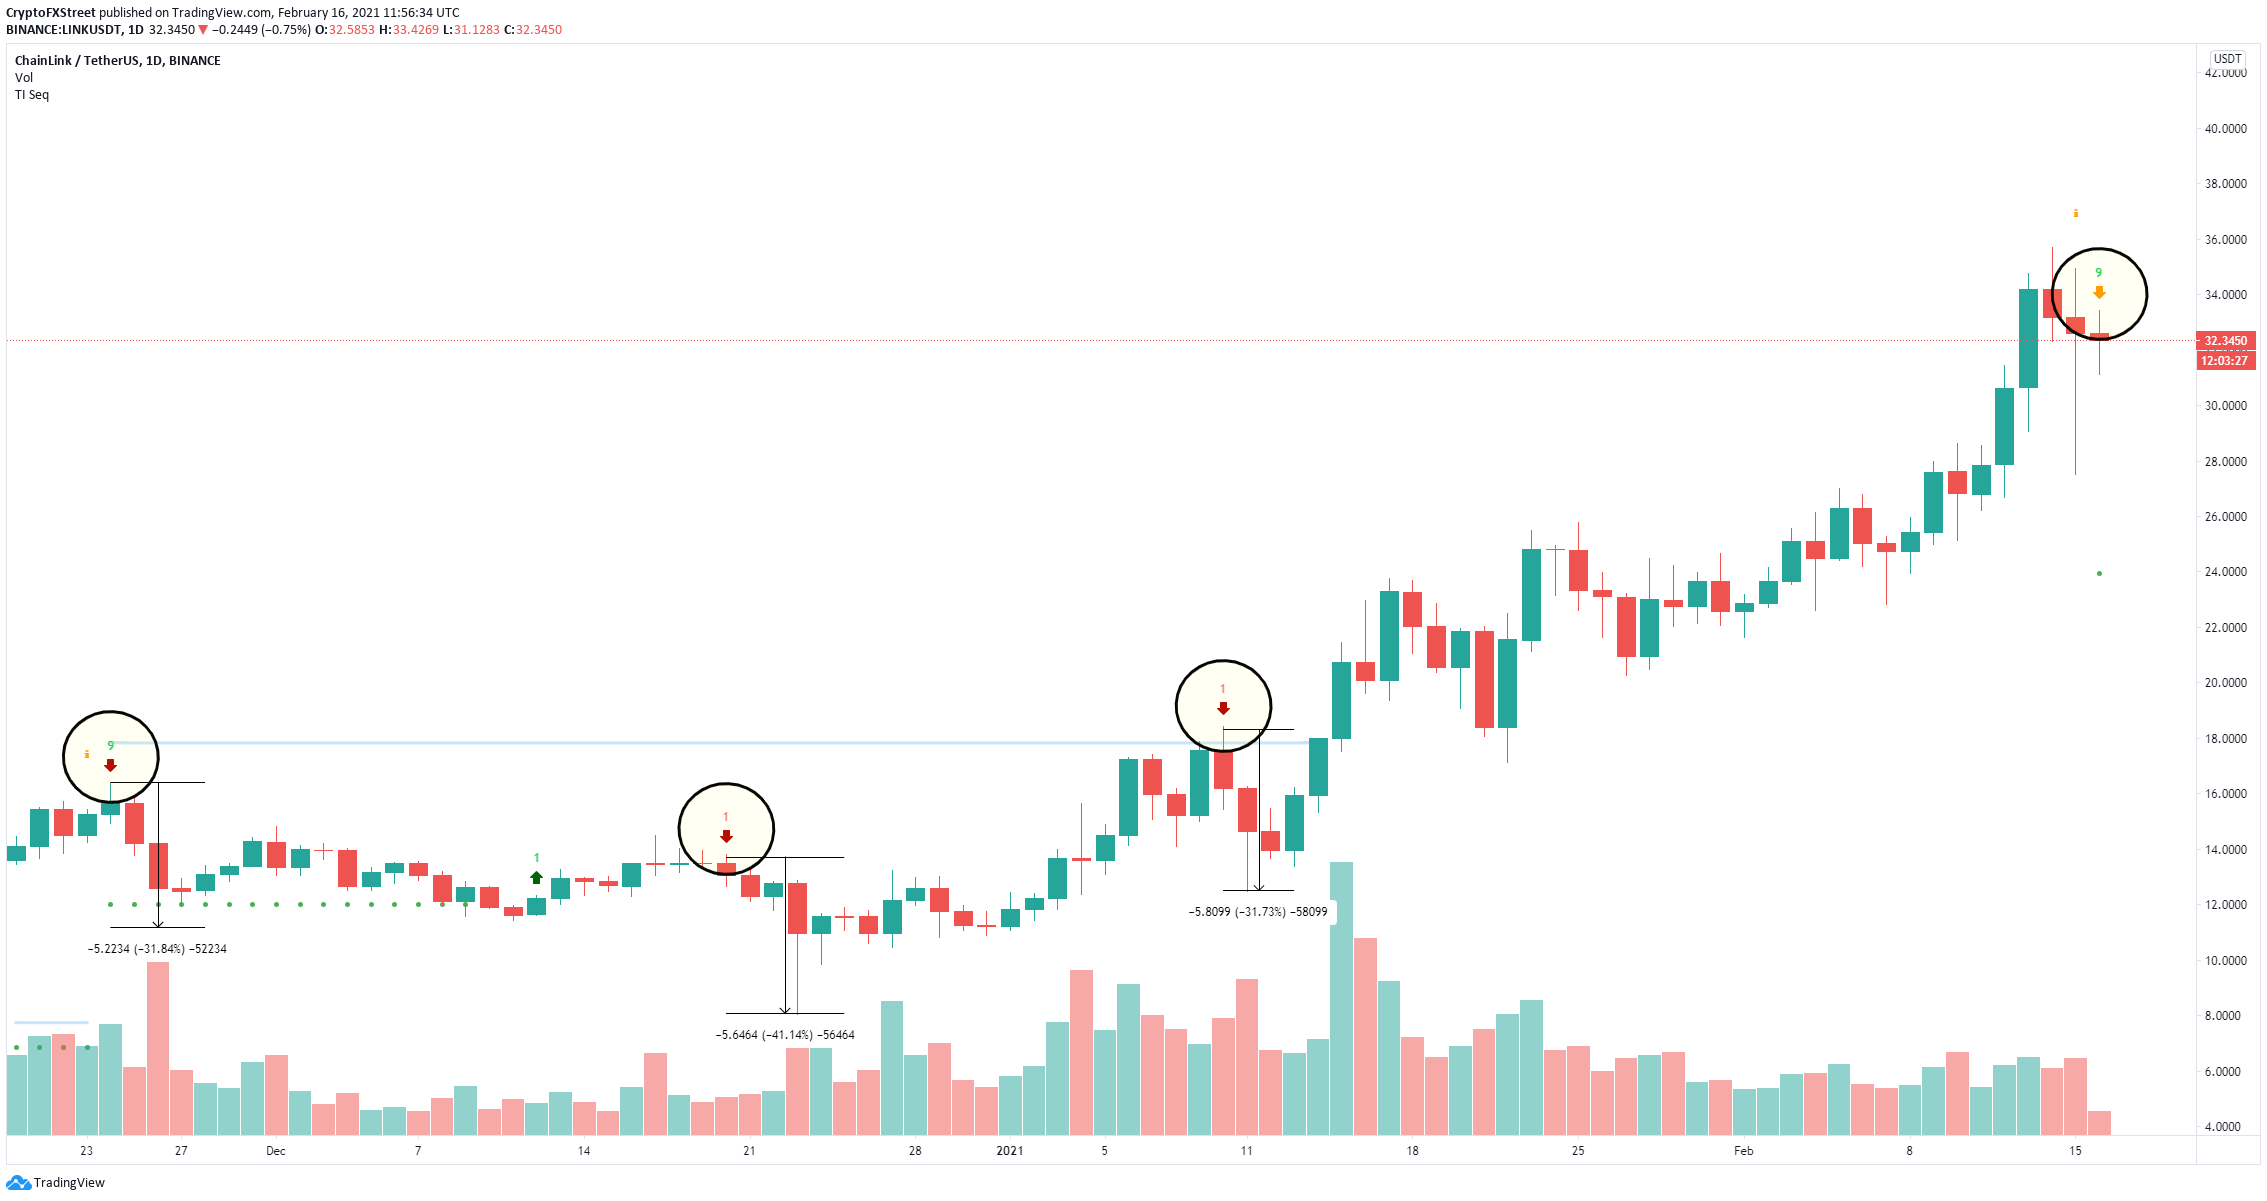
LINK/USD daily chart

Nonetheless, on the 4-hour chart, LINK bulls have defended the lower boundary several times in a row and aim for a rebound towards the upper trendline at $34. A breakout above this level can drive Chainlink price to a new all-time high at $42.

Author

Lorenzo Stroe

Lorenzo Stroe

Independent Analyst

Lorenzo is an experienced Technical Analyst and Content Writer who has been working in the cryptocurrency industry since 2012. He also has a passion for trading.

More from Lorenzo Stroe
Share:

Editor's Picks

Ripple falters amid sell-off jitters and negative funding rates

Ripple (XRP) has come under pressure, drifting lower to $1.35 at the time of writing on Tuesday. The over 2% correction looks poised to erase the previous day’s gains, which lifted the remittance token to $1.42.

Bitcoin could risk $50,000 amid the US-Iran war, mirroring the Russia-Ukraine war losses

Bitcoin (BTC) remains at downside risk amid escalation in the Middle East war, as Iran retaliates against the US, Israel, and its neighbouring countries. Drawing parallels to the early days of the Russia-Ukraine war, Bitcoin could extend losses below $60,000. 

Crypto Today: Bitcoin, Ethereum, XRP pull back as sentiment remains in extreme market fear

The cryptocurrency market is broadly in the red on Tuesday as the Middle East grapples with an escalating war. Bitcoin (BTC) is in a pullback, trading below $67,000 at the time of writing, and most altcoins follow suit.

Bitcoin slips below $67,000 as risk-aversion grows amid escalating US-Iran war

Bitcoin price slides 3% on Tuesday, nearly erasing the previous day's rebound. US-listed spot ETFs recorded an inflow of more than $450 million while Strategy added 3,015 BTC on Monday.

Bitcoin Price Annual Forecast: BTC holds long-term bullish structure heading into 2026

Bitcoin (BTC) is wrapping up 2025 as one of its most eventful years, defined by unprecedented institutional participation, major regulatory developments, and extreme price volatility.

Bitcoin: Another month of losses, and it’s been five

Bitcoin (BTC) price is stabilizing around $68,000 at the time of writing on Friday, but the Crypto King is poised to close February on a fragile footing, marking its fifth consecutive month of losses since October and a rare start to the year with back-to-back monthly corrections.