Chainlink price might face a correction before it can climb back to 2023 highs
- Chainlink price has risen by more than 32% in the span of two weeks, inching closer to the $8 mark.
- The supply held on the exchanges has seen a decline of more than 9 million LINK, which is a positive sign.
- The recent rally has enticed investors to become active again, however, they may face a potential drawdown.

Chainlink price has performed exceptionally over the past couple of days, making room for profits for investors. However, further gains from here on would warrant a market cooldown before the rally can continue.
Chainlink price hits a monthly high
Chainlink price trading at $7.6 at the time of writing is up by 32% in the past two weeks. The recent recovery rally resulted in the breach of the resistance level of $7.4, and a retest of the same as a support floor is now crucial in order to sustain this rise.
However, looking at the Relative Strength Index (RSI), it seems likely that the altcoin might see some red candlesticks or sideways movement, at least for the next few days. This is because the indicator is at the cusp of being in the overbought zone above 70.0, which usually results in corrections as the market cools down after being overheated.
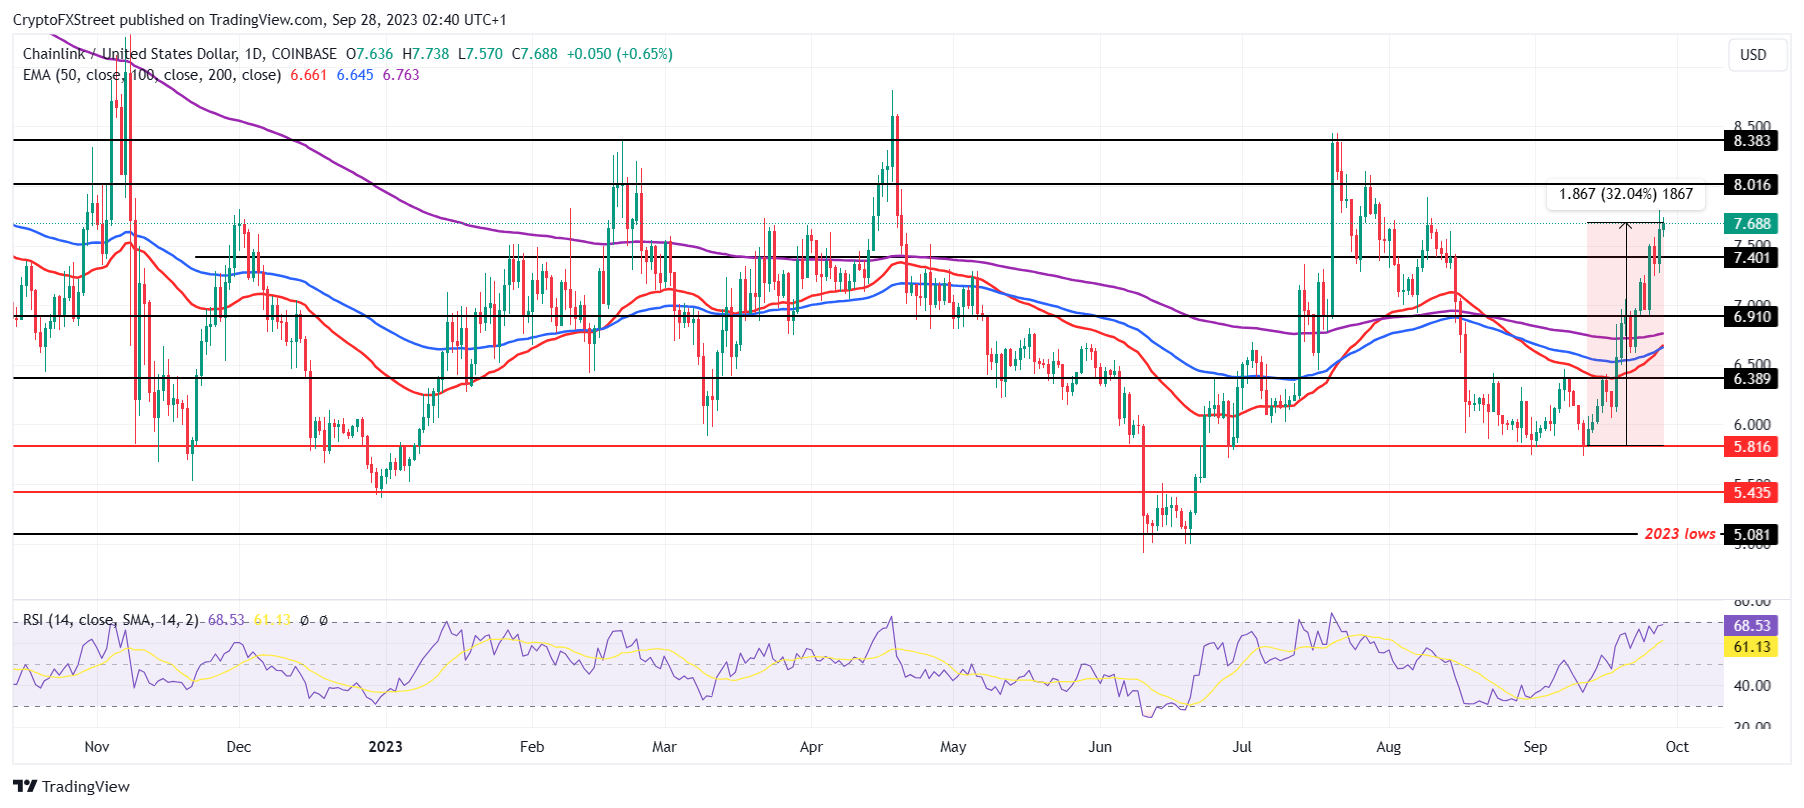
LINK/USD 1-day chart
Thus, at the most, LINK is only looking at a fallback to $6.9. On the off chance that the rally continues, the altcoin’s next target would be $8, breaching which would set the altcoin up for rising to $8.3. Breaching the same would invalidate the bearish thesis and set LINK up for a rise to 2023 highs of $8.5.
LINK accumulation could take precedence
The rally has likely raised the interest of investors, which has resulted in the selling pressure going down. The supply on exchanges has declined by more than 9 million LINK worth around $63 million at the current price.
This is a positive sign as it suggests that investors have either moved their holdings to a cold wallet or acquired more LINK tokens. In any case, this would prevent a severe drawdown during corrections.
 [06.26.43, 28 Sep, 2023]-638314649720631441.png)
Chainlink supply on exchanges
This optimism of investors is also evinced by their presence on the network. The addresses conducting transactions on the chain hit a two-month high this past week, crossing 3.5k. The active addresses metric is a good measure of investors' interest as it gauges whether the rally will be sustained or not.
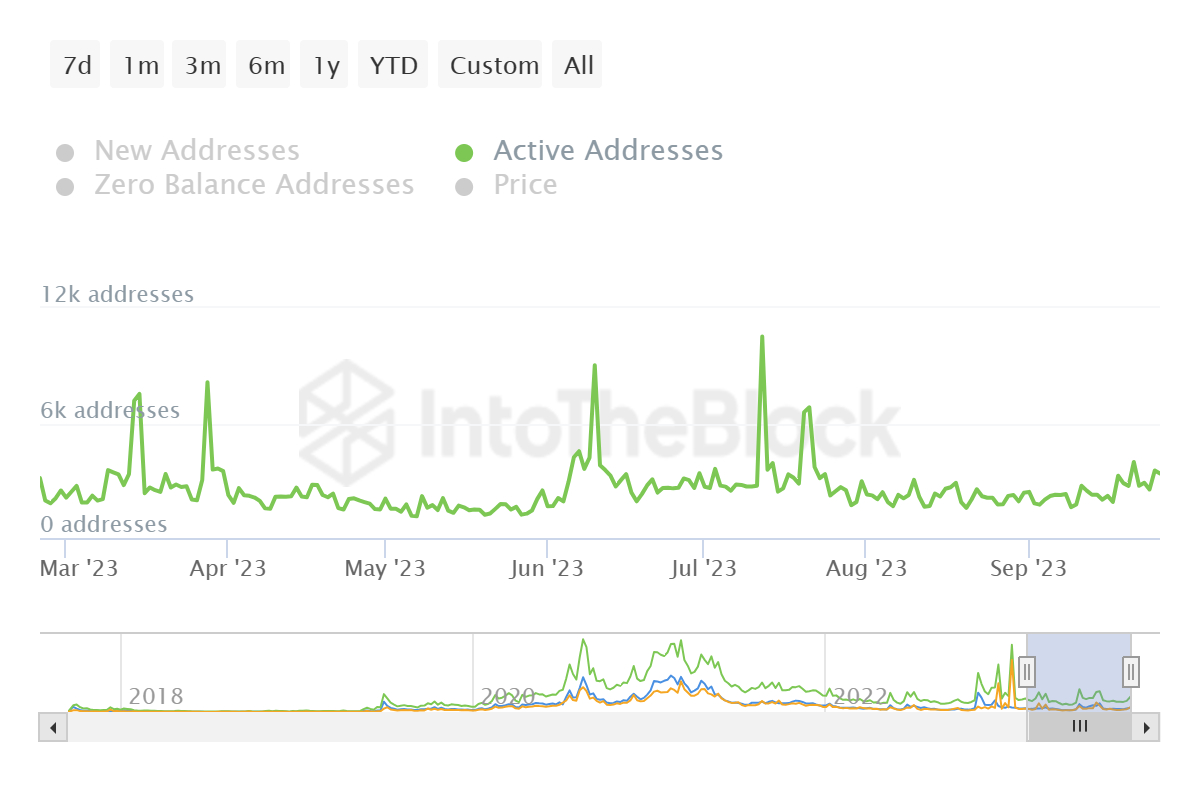
Chainlink active addresses
Since the high number of active investors suggests bullishness, LINK might be able to prevent a significant decline.
Like this article? Help us with some feedback by answering this survey:
Author

Aaryamann Shrivastava
FXStreet
Aaryamann Shrivastava is a Cryptocurrency journalist and market analyst with over 1,000 articles under his name. Graduated with an Honours in Journalism, he has been part of the crypto industry for more than a year now.


