Chainlink price hits resistance, making LINK uptrend weaker
- Chainlink price stumbles for the third time at longstanding topside trend line.
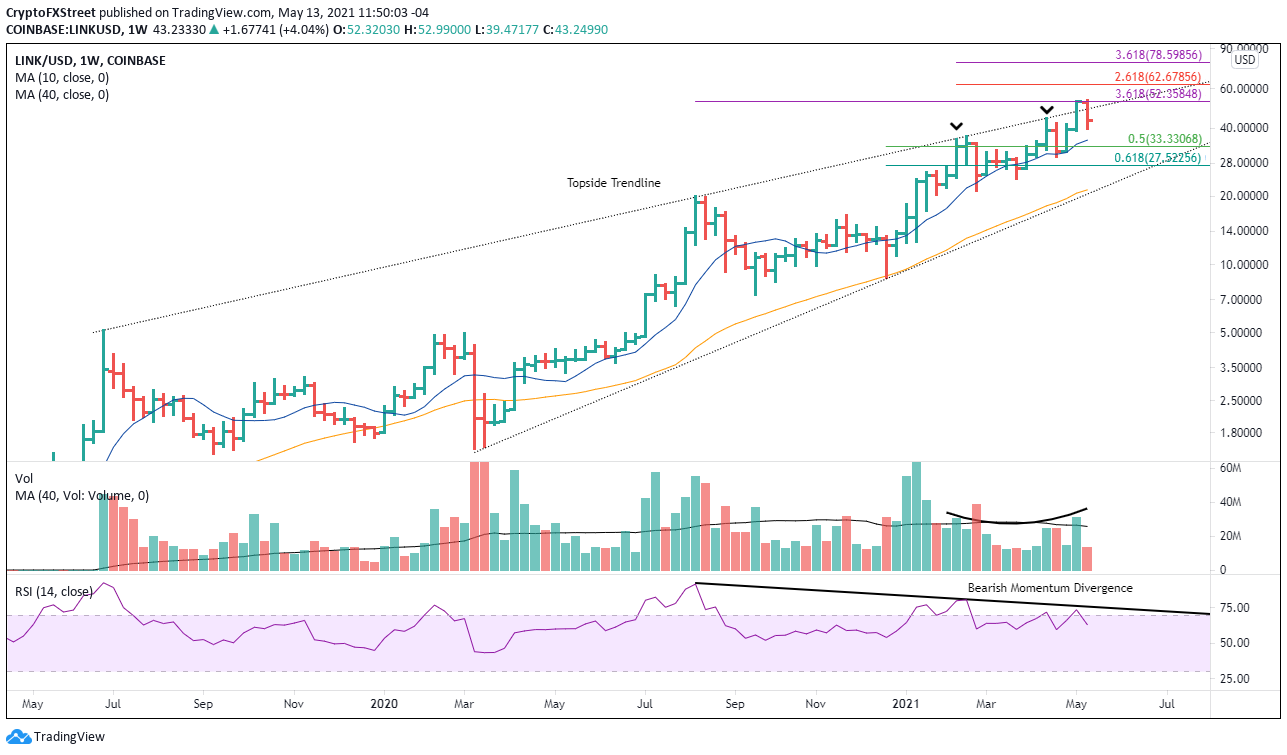
- Bearish momentum divergence on the weekly chart threatens the current rally.
- Weak accumulation/distribution profile undermines rally sustainability.
-637336005550289133.jpg)
Chainlink price is at a pivotal point on the charts as it battles the topside trend line originating in 2019. Faltering momentum continues to overshadow the proposals for a decisive rally above the trend line, putting LINK at risk of another correction, potentially deeper than the other two in 2021.
Chainlink price searches for validation amidst conflicting technicals
Fall-off risk is heightened by the sell-off in the cryptocurrency market overnight and the prospect of spillover into today. Chainlink price was already struggling, but the combination of stubborn resistance and broader market weakness raises the probability that it perpetuates the cycle of local tops at the outstanding trend line, as was experienced at the February and April highs.
At the junction of price with the trend line is the 361.8% Fibonacci extension of the last notable decline from August-September 2020 at $52.35. Interestingly, last week’s close was at $52.34, and this week’s high was $52.99, affirming the technical importance of the extension level.
Chainlink price weakness should endure, particularly within the context of broad-based selling. Immediate support accrues at the 10-week simple moving average (SMA) at $35.53, followed closely by the 50% retracement of the rally beginning at the end of 2020 at $33.33. A failure at the 61.8% retracement of $27.52 presents the possibility for a test of the confluence of the 40-week SMA at $21.41 with the rising trend line currently at $20.43, representing a 50% decline from price at the time of writing.
Adding to the bearish outlook is the lingering bearish momentum divergence that arises when the Relative Strength Index (RSI) fails to confirm the Chainlink price and, in this case, the weekly RSI. As well, the weekly volume totals for up weeks have not been flattering since the initial surge in early January, questioning the commitment of traders to support sustained selling pressure.
LINK/USD daily chart
A weekly close above the topside trend line and the 361.8% extension at $52.35 nullifies the bearish prognosis and advances the opportunity for Chainlink price to reach the 261.8% extension of the February decline at $62.68 and then the 361.8% extension of the same decline at $78.60.
Author

Sheldon McIntyre, CMT
Independent Analyst
Sheldon has 24 years of investment experience holding various positions in companies based in the United States and Chile. His core competencies include BRIC and G-10 equity markets, swing and position trading and technical analysis.


