Chainlink price knocks out dual resistance, LINK poised for all-time highs
- Chainlink price reaching outer limit of 9-day returns for 2021.
- Topside trendline looms over rally sustainability.
- IOMAP data shows trivial resistance at current price level.
-637336005550289133.jpg)
Chainlink price broke through the descending channel on April 30 after three days of being locked at the intersection of two crucial resistance zones. Demand has not climbed over the last three days, but the developing inside-day illustrates a stalemate between accumulation and distribution, setting the platform for a trend continuation.
Chainlink price sponsor Grayscale, delivers superior returns
The Grayscale Chainlink Trust announced they are up 41.34% since the end of February with $5.8 million assets under management (AUM) in Chainlink (LINK). The trust’s official inception was February 26, joining the lineup of other single asset investment options from Grayscale.
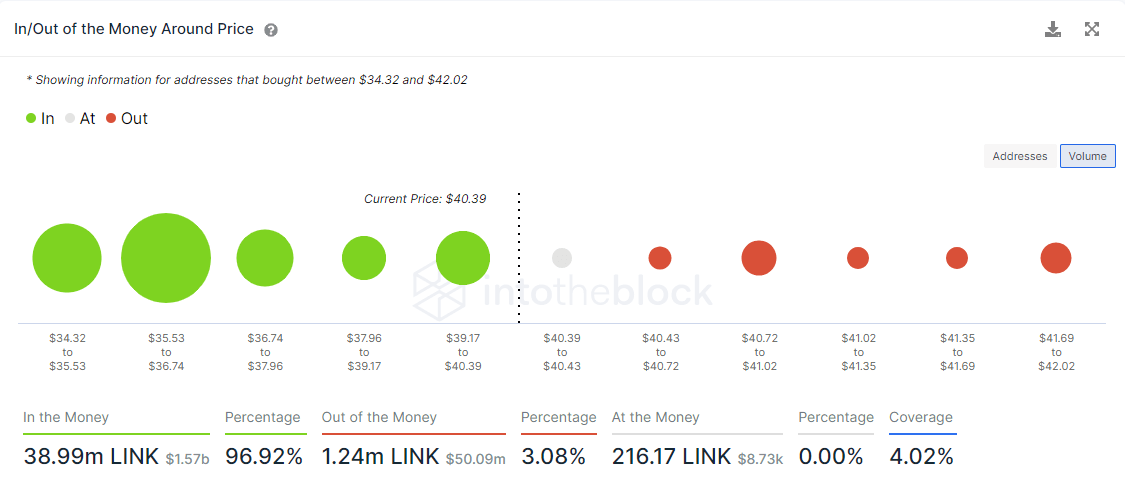
The latest Intotheblock In/Out of the Money Around Price (IOMAP) data reveals meager resistance at current Chainlink price levels with a large cluster of support above the dueling zones of support.
In the range of $35.53 to $36.74, 13.04k addresses purchased 18.73 million LINK with an average price of $36.30. The range sits slightly above the upper limit of the Chainlink price congestion at $35.10, going back to the February high and above the upper trend line of the descending channel at $34.80.
LINK IOMAP data
The breakout of the Chainlink price from the descending channel was a critical development for the altcoin and elevated the prospect of a new all-time high at $44.16. Standing in the way of a sustainable rally is the topside trendline that begins June 2019 and travels through the August 2020 high at $47.08, and the 161.8% Fibonacci extension of the February crash at $46.76.
In the short-term, some consolidation may be necessary considering that the rally since the April 25 low (9-days) has yielded a 28.80% return, pushing Chainlink price to the upper range of 9-day returns going back to the end of January. Each time Chainlink has gained near 30%; there has been a subsequent pause or correction.
Upside targets for Chainlink price begin with the 161.8% extension at $46.76, followed by the topside trendline at $47.08 and then the 361.8% extension of the August-September 2020 correction at $52.36.
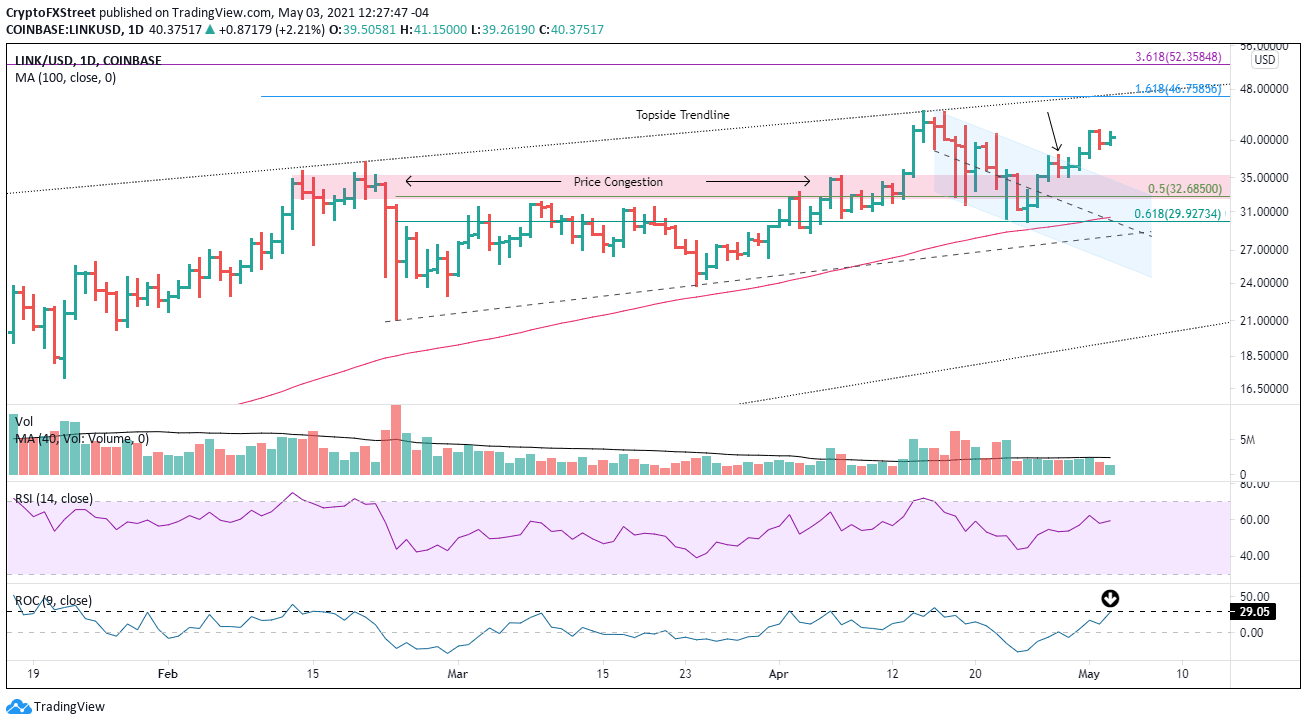
LINK/USD daily chart
The downside for Chainlink price is supported by the congestion marked in red, the descending channel marked in blue, and the 50% retracement of the February-April advance at $32.68.
Author

Sheldon McIntyre, CMT
Independent Analyst
Sheldon has 24 years of investment experience holding various positions in companies based in the United States and Chile. His core competencies include BRIC and G-10 equity markets, swing and position trading and technical analysis.


