Chainlink Price Forecast: LINK looming correction could sabotage November's 60% rally
- Chainlink holds above $14 following a retreat from November high, around $15.7.
- An ascending pattern forming on the 4-hour chart hints at a possible correction.
-637336005550289133.jpg)
Chainlink is up more than 50% since the low traded earlier this month. The recovery in the last three weeks put an end to the downtrend from the all-time high of $20. Following the recent high at $15.7, Chainlink is staring into a potential correction likely to retest $13 and $12, respectively.
Chainlink recovery hits a wall as declines linger
At the time of writing, LINK is doddering at $14.8 after a shallow bounce from $14 (short term support). The formation of an ascending wedge pattern points to a possible breakdown in the near term.
Ascending wedge patterns are common in technical analysis and signal decreasing volume, thus signaling price reversal. For Chainlink, trading under the lower trendline could trigger more sell orders, creating enough bearish force to the token to $13 and $12, respectively.
The 50 Simple Moving Average in the 4-hour timeframe may help absorb some of the selling pressure. Besides, the 100 SMA reinforces the support at $13. On the other hand, the 200 SMA will prevent losses to $12.
-637417055509332574.png)
LINK/USD 4-hour chart
Similarly, the TD Sequential indicator might present a sell signal on the daily chart in the short term. The sell signal will manifest in a green nine candlestick. If validated, Chainlink is likely to explore the downside in one to four daily candlesticks.
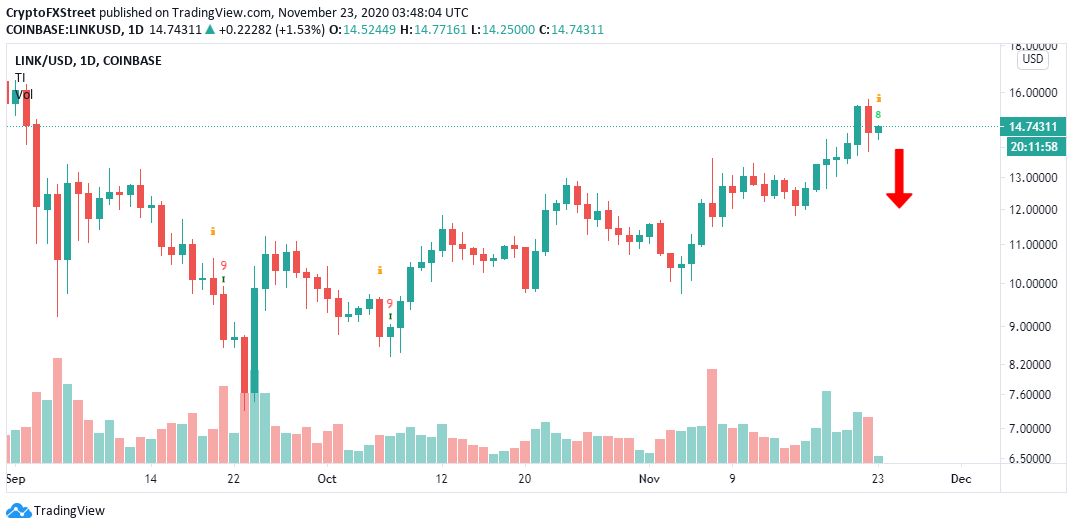
LINK/USD daily chart
On the other hand, Santiment’s network growth on-chain metric suggests that network activity is rising. The metric measures the number of new addresses joining the network daily, as illustrated in the chart below.
 [08.20.27, 23 Nov, 2020]-637417056492480154.png)
Chainlink network growth chart
Generally, increasing network growth signals a potential rise in the price of the token. Therefore, Chainlink could ignore the bearish technical perspective and continue with the rally to $18 because of the rising number of new addresses joining the network.
Author

John Isige
FXStreet
John Isige is a seasoned cryptocurrency journalist and markets analyst committed to delivering high-quality, actionable insights tailored to traders, investors, and crypto enthusiasts. He enjoys deep dives into emerging Web3 tren


