Chainlink price analysis: LINK flashes buy signal on daily chart
- Immediate resistance for LINK lies at $8.75, as per IOMAP.
- Long-term holders and whales have been consolidating their LINK holdings.
-637336005550289133.jpg)
Chainlink has flashed the buy signal per the TD sequential indicator. Currently, the price is under heavy bearish control as LINK/USDT has dropped from $9.69 to $8.62 since October 6. We can expect LINK to fall to the $7.69 support level before it jumps up.
LINK/USDT daily chart
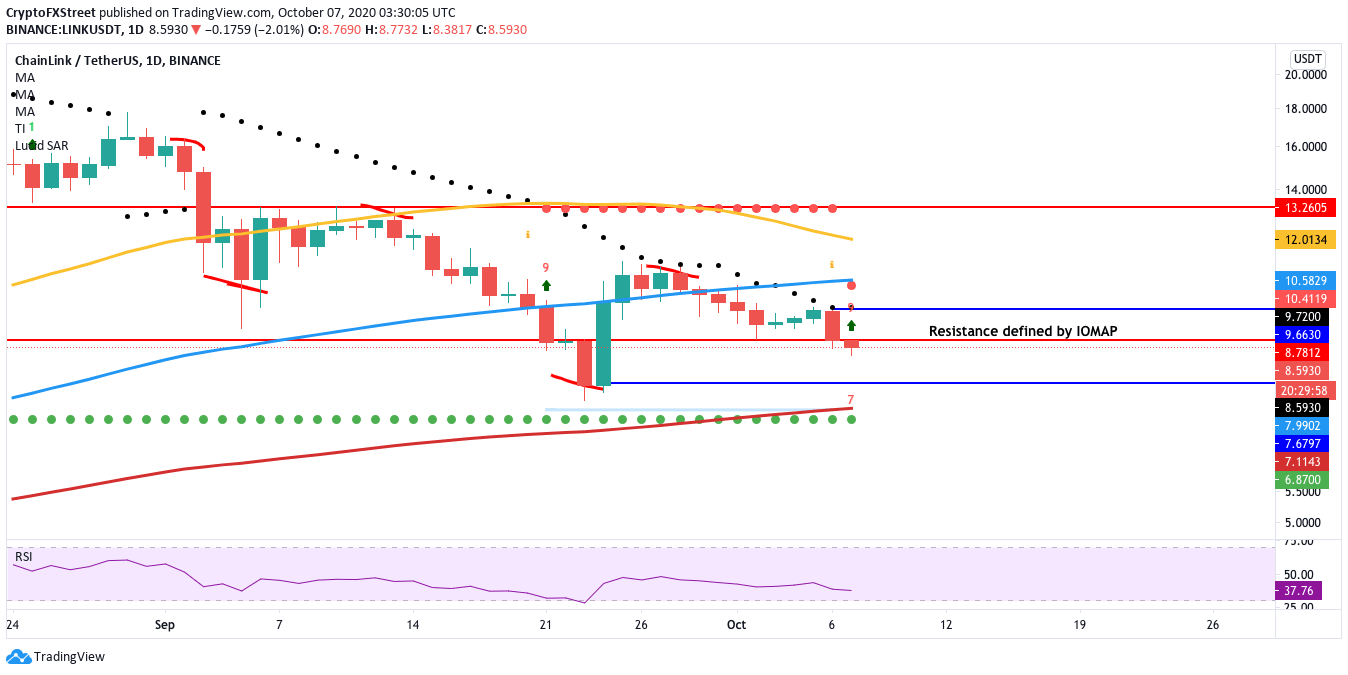
After charting an all-time high on 16th August 2020, the price has charted a series of lower highs and lower lows. As defined by the TD sequential, the upper limit of the bullish growth lies at $13, which could reverse this downward trend. However, the buyers presently face multiple challenges before it could do that.
LINK needs to break above the $9.76 line to reverse the parabolic SAR from bearish to bullish. Following that, it needs to break above the SMA 50 and SMA 100 curves to reach the $13-level. However, the first thing that LINK bulls need to do is to break past the $8.75 resistance level, as defined by the IOMAP.
Chainlink IOMAP
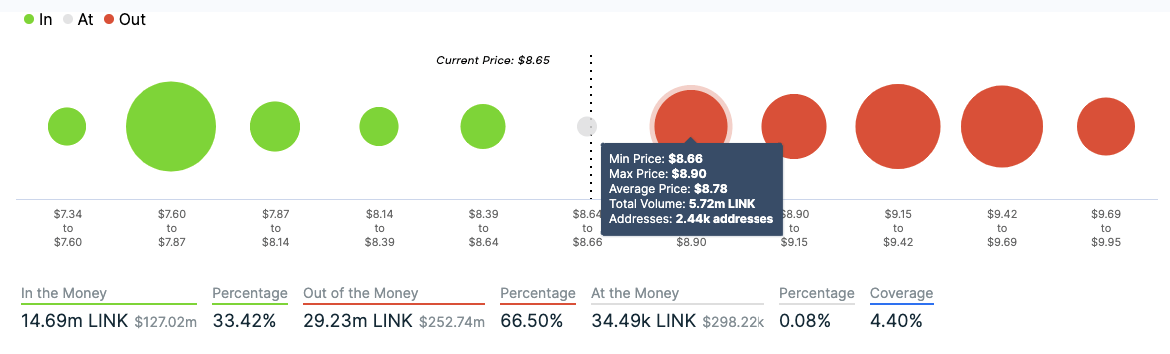
IntoTheBlock’s “In/Out of the Money Around Price” (IOMAP) helps us visualize strong resistance and support levels. As can be seen, the bulls face immediate resistance at $8.75, where 2,440 addresses had previously purchased 5.72M LINK tokens.
LINK/USDT 4-hour chart
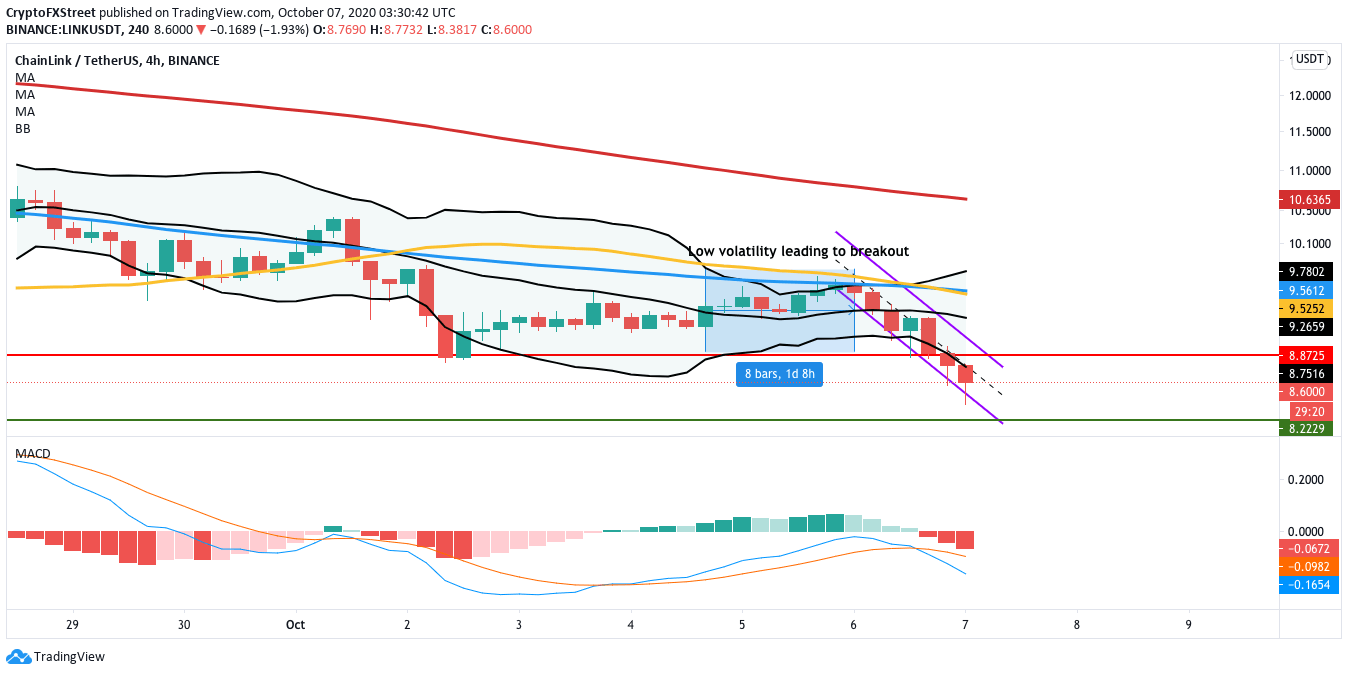
In the 4-hour time frame, LINK was going through a period of low volatility, as evidenced by the Bollinger bands' squeezing. Following that, the price had a bearish breakout and is currently trending in a descending channel formation. The MACD shows increasing bearish momentum, so further downward movement is expected. As previously mentioned, the price has room to fall to $7.69 before it begins the upward price swing.
This bullish outlook could be invalidated if the bears manage to break the price below the support line and drop to the 200-day SMA curve.
LINK on-chain metrics
Let’s go through some on-chain network metrics for the decentralized oracle.
Amount held by top 100 non-exchange addresses
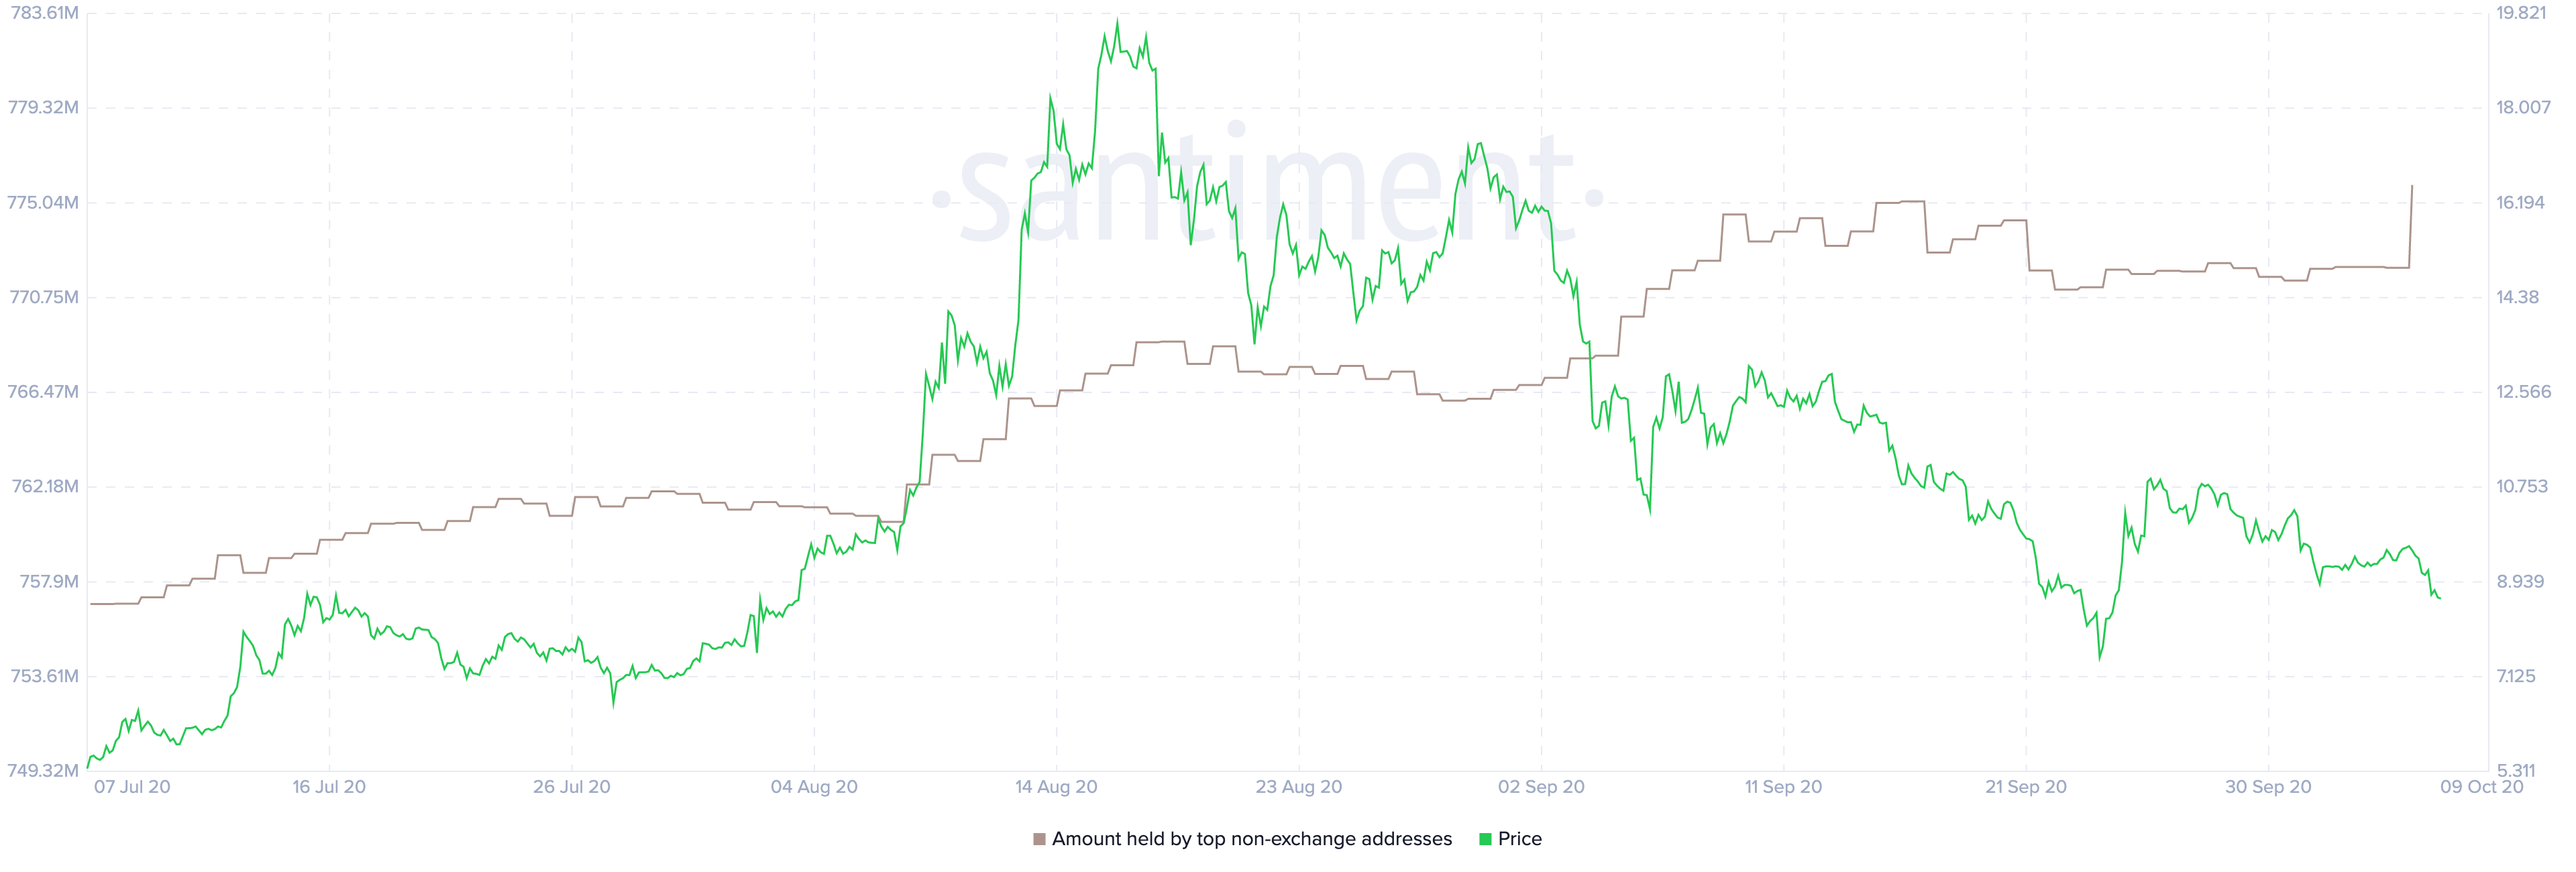
From July 7 to September 16, the number of LINK tokens held by the top 100 non-exchange addresses increased from 756.89M to 775.11M. Following that, the amount held by these addresses dropped to 771.12M over the next six days. Since then, the amount held by these addresses has pretty much stayed the same. So, while the whales may not be going through a vast accumulation phase right now, it looks like they aren’t selling their holdings either.
Coin supply on exchanges
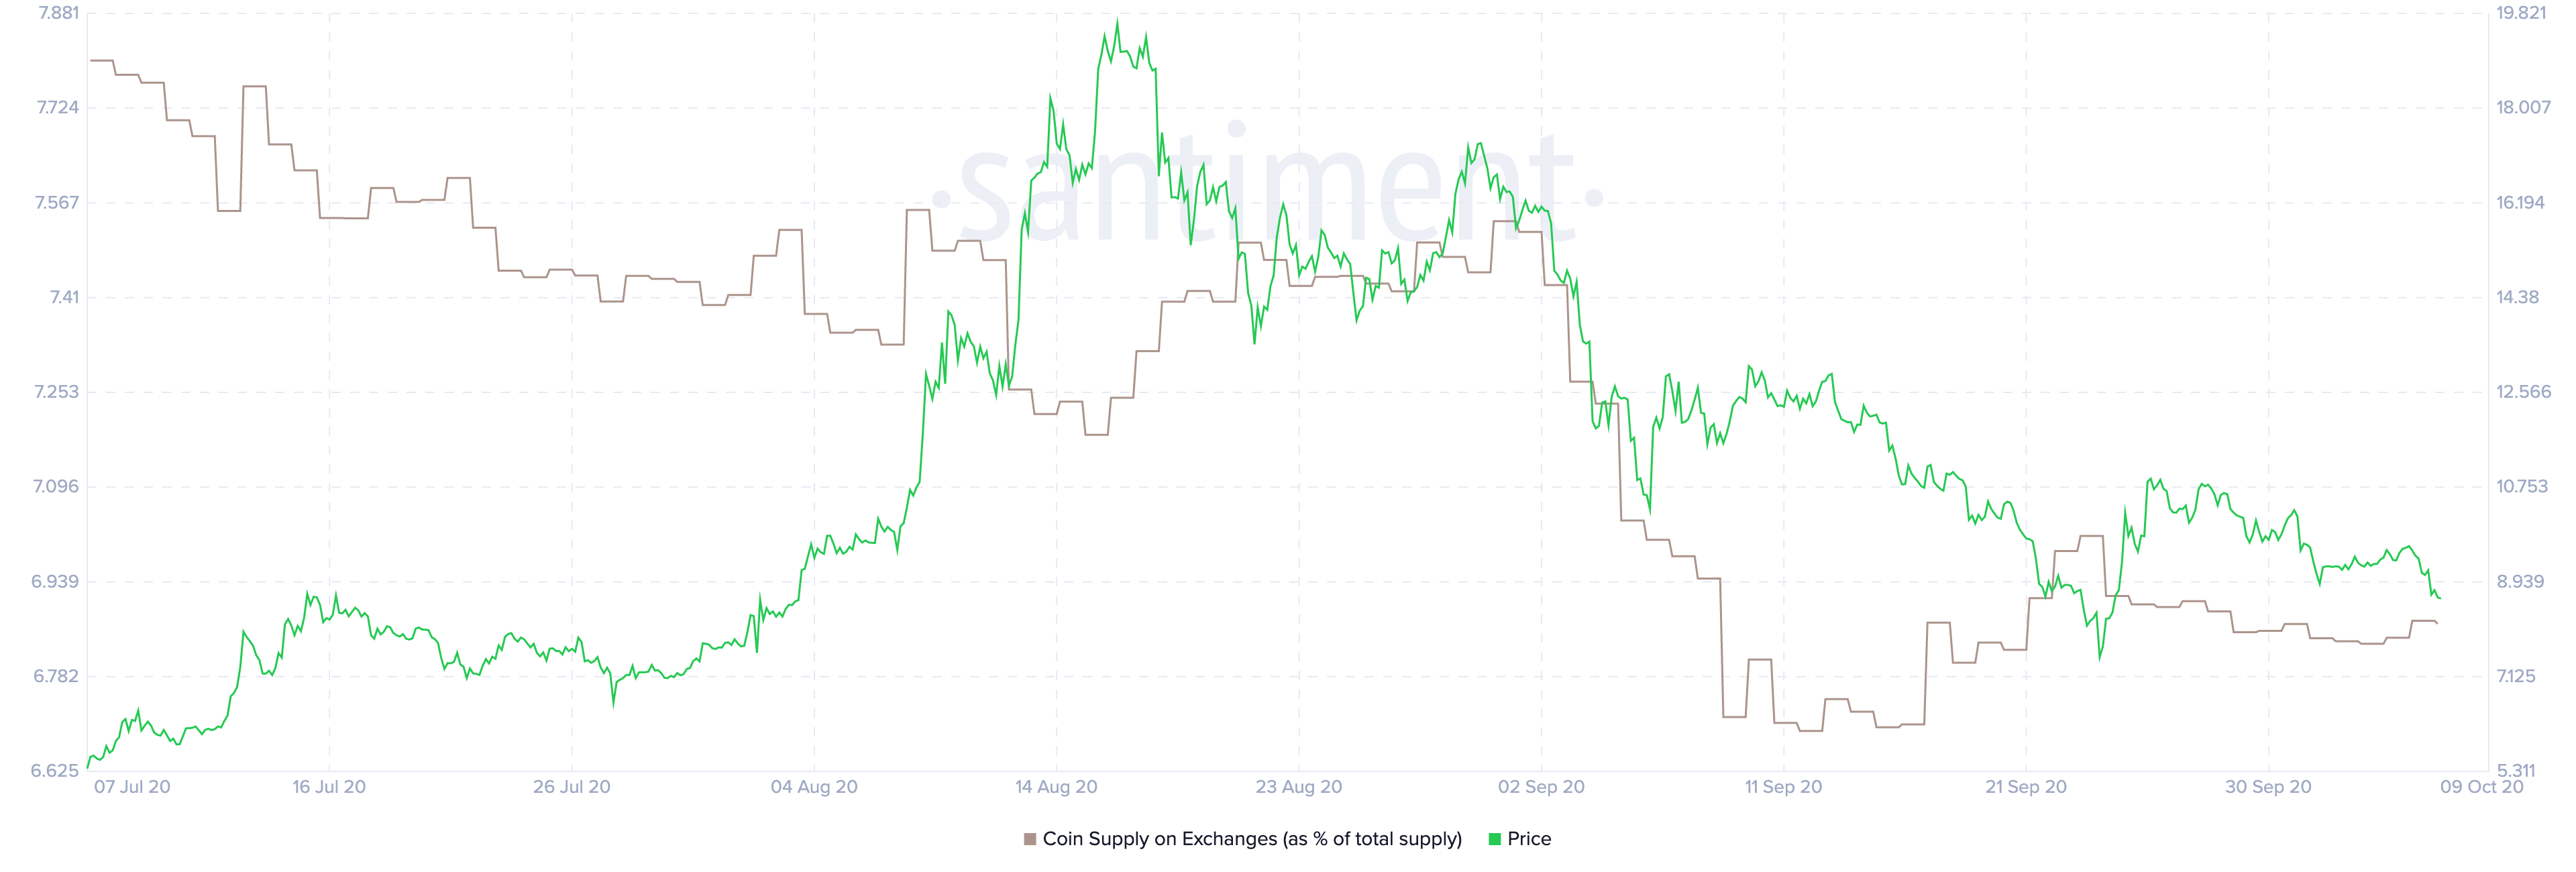
This chart shows us the percentage of circulating LINK that’s currently held inside exchange wallets. A drop in this metric indicates that users take out their tokens from the exchange and keep them secure in their personal wallets. On July 7, Chainlink's coin supply reached a high of 7.80% in this three-month time frame.
This number dropped to 6.69% on September 12. Since then, the coin supply percentage has gone up slightly to 6.87% as of press time. Despite the rise, 6.87% is still a low percentage, so this is a good sign that a vast majority of LINK tokens are currently safely locked up in user wallets.
Chainlink mean coin average
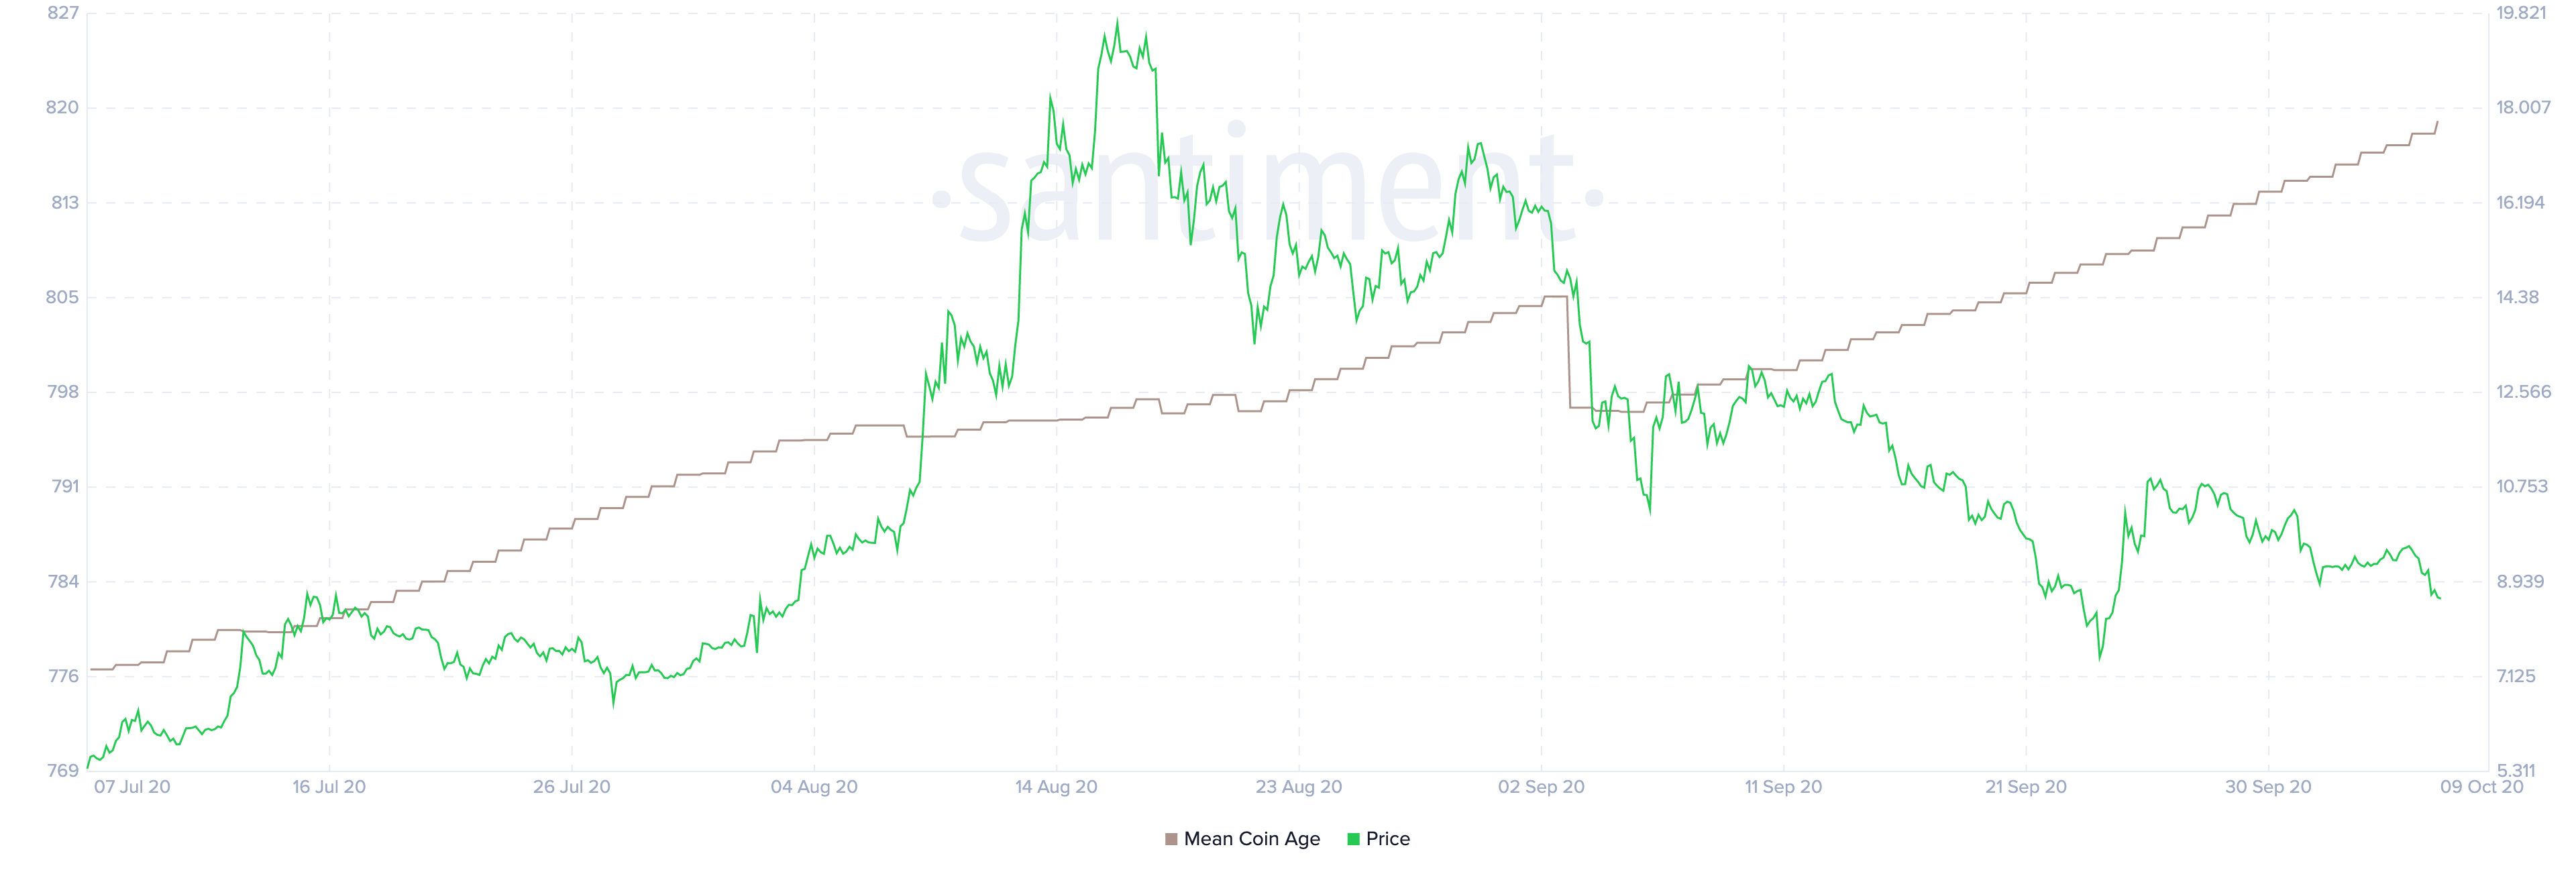
The mean coin average is a useful tool that helps us understand if the long-term holders are consolidating their positions or simply selling off. Apart from a dip on September 3, the MCA has been steadily increasing. So, longe-term LINK holders have been pretty much on a buying spree irrespective of the price action. This is a positive sign since this shows that LINK holders have faith in the asset.
Verdict: It is time for the bulls to take charge and make the most of the positive price swing. While it will be too optimistic to hope for a move till $13, we can expect a return to touch the SMA 100 ($10.50). The bears can take control by ensuring that the price falls below the $7.69 support line.
Author

Rajarshi Mitra
Independent Analyst
Rajarshi entered the blockchain space in 2016. He is a blockchain researcher who has worked for Blockgeeks and has done research work for several ICOs. He gets regularly invited to give talks on the blockchain technology and cryptocurrencies.


