Chainlink Price Prediction: LINK eyes $7 following rejection from critical resistance level
- LINK has plummeted by 51.60% in a little over 45 days.
- Since September 10, the number of whales holding 1M to 10M LINK tokens has fallen from 54 to 49.
-637336005550289133.jpg)
After running out of momentum near the $10.75 resistance line and the 100-day moving average, LINK has been sludging downward for the last five days. Technical analysis tells us that we are about to see a price correction to $7.
LINK/USD daily chart
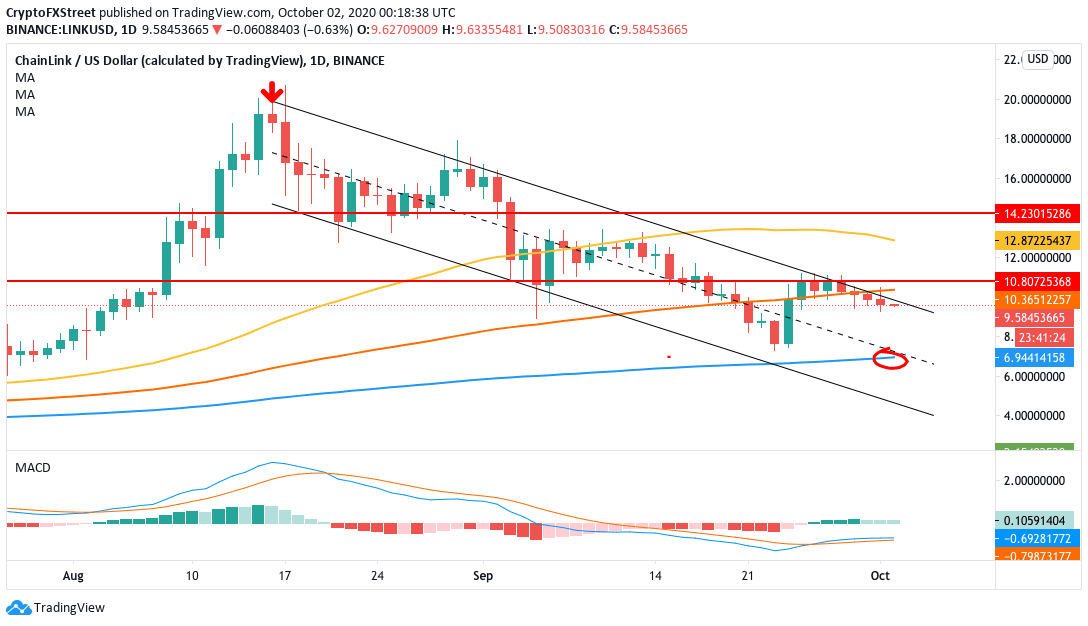
After charting an all-time high of $16.83 on August 16, 2020, the decentralized oracle has dropped to $9.60, as of press time. That’s a 51.60% price in a little over 45 days. This downward fall was triggered by the evening star pattern, which prompted the price to fall in a parallel channel formation. The price has faced repeated rejection at the parallel channel's upper bound and the SMA 100 in the last five days.
These repeated rejections should give the bears enough confidence to take the price down to the SMA 200 curve, which is currently hovering around the $7 region.
LINK/USD 4-hour chart
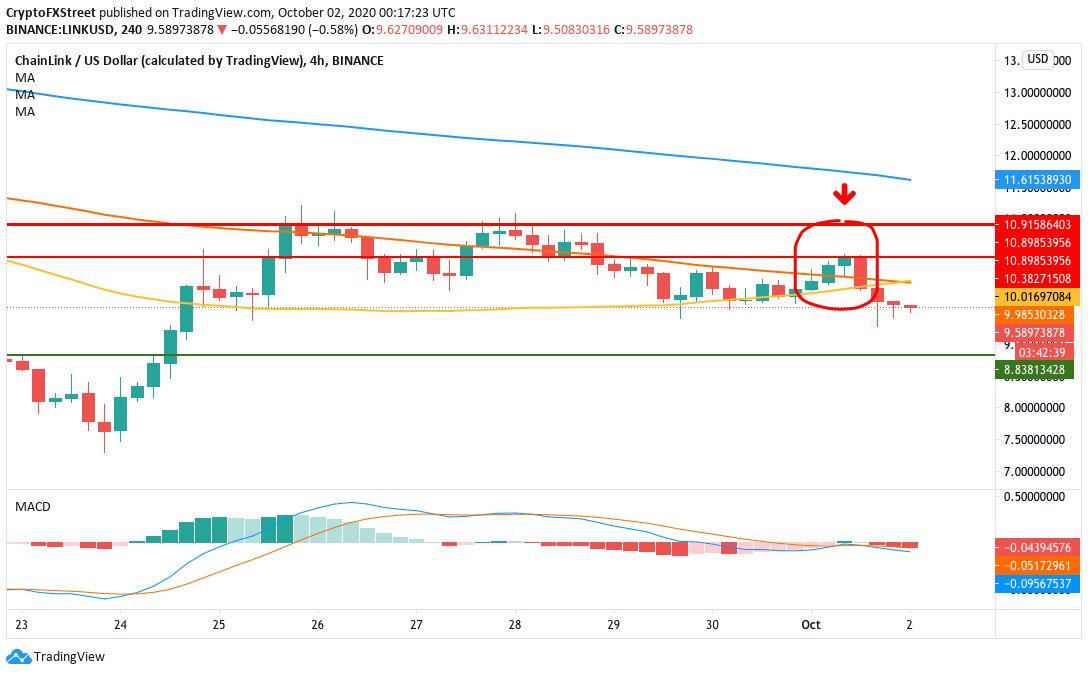
The 4-hour LINK/USD candlesticks have charted a bearish three line strike pattern and dropped below the SMA 50 and SMA 100 curves. While the latter two have charted a bullish cross pattern, it looks like the sellers have wholly negated it. The MACD also shows increasing bearish momentum, which shows that sellers have complete control of the market in this time frame.
LINK IOMAP
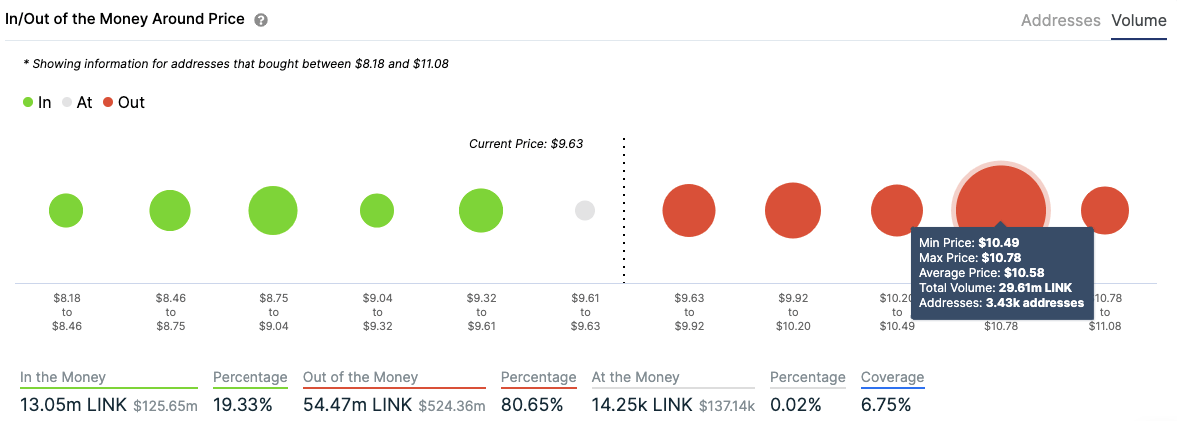
IntoTheBlock’s “In/Out of the Money Around Price” (IOMAP) model indicates that there is a strong resistance wall at $10.60, where 3,430 addresses have previously bought 29.61 million LINK tokens. On the downside, there is a lack of significant support levels, so LINK is presently vulnerable to intense selling pressure.
LINK on-chain metrics
#1 LINK whales
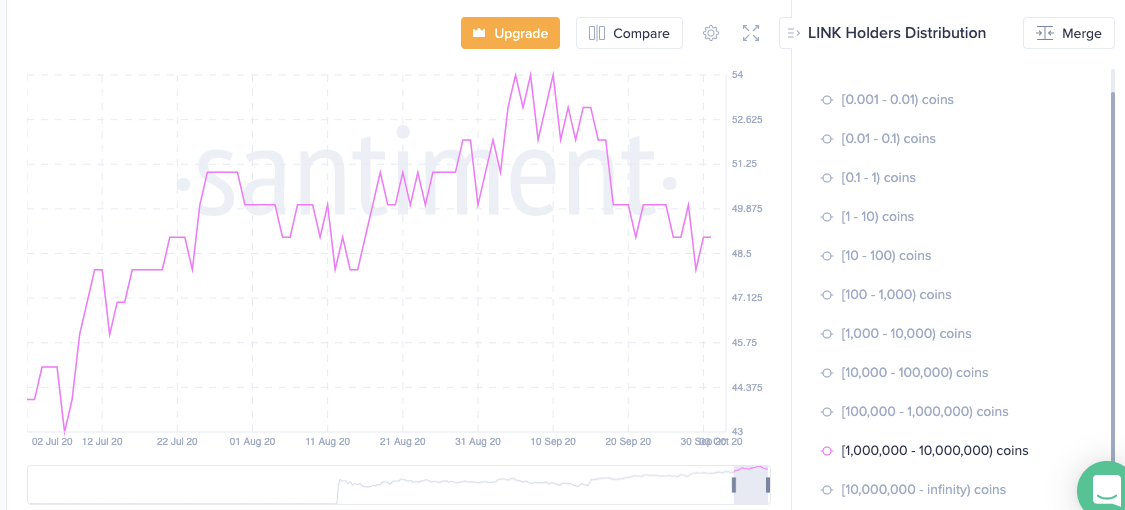
Santiment’s holders distribution chart reveals that there has been a drop in the investors holding 1M-10M LINK tokens. Since September 10, the number of these holders has fallen from 54 to 49. While that may not sound like a large number, one must keep in mind these are holders with at least a million LINK tokens (aka whales). If they continue to dump their holdings, there will be a major negative impact on the price.
#2 LINK new addresses
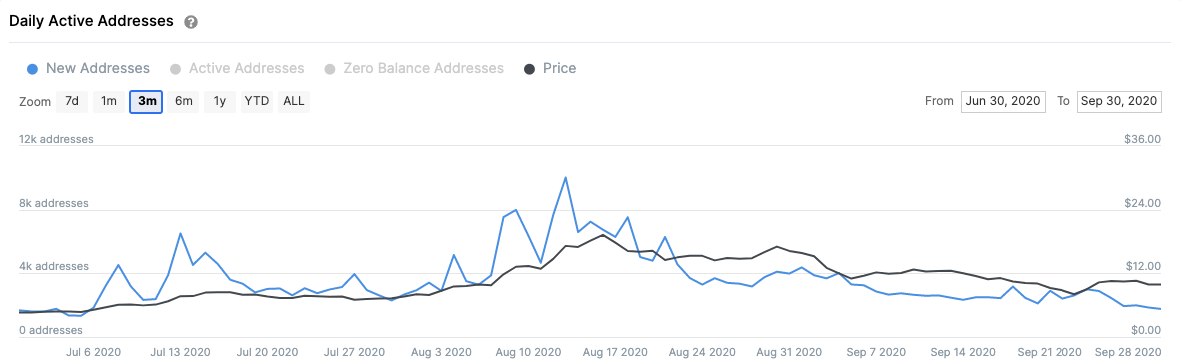
IntoTheBlock’s “Daily Active Addresses” model shows that the number of new addresses created on the Chainlink network topped-out on August 13 at a high of ~10,000 addresses per day, calculated on a 3-month trailing average. Since then, the decentralized oracle’s network growth has declined by new active addresses per day. Only 1,760 new addresses were created at press time based on this trailing average, which can be considered a major bearish sign for LINK.
Not all doom and gloom
While the signs presently do not look good, Santiment does have some good news for LINK holders.
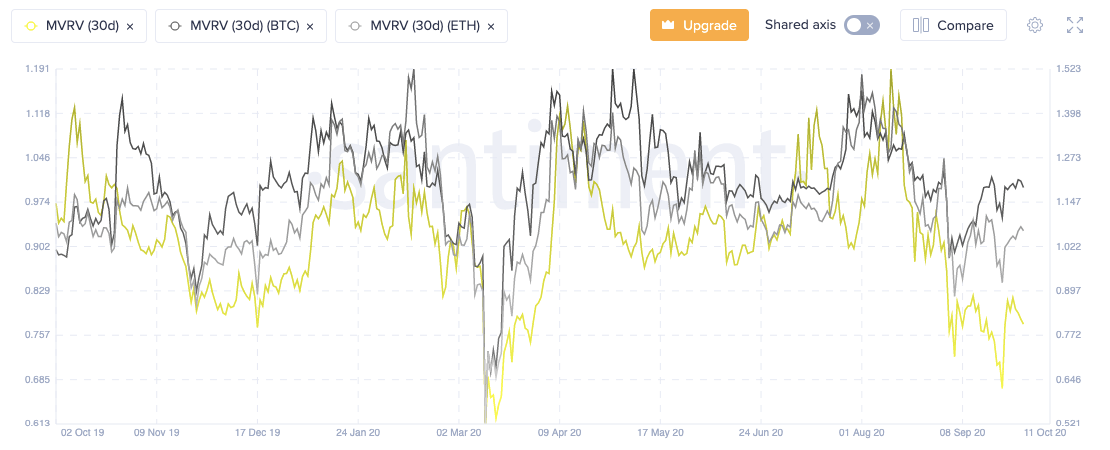
Market Value To Realized Value (MVRV) shows the average profit or loss of all LINK holders based on the price when each token last moved.
The analytics firm tweeted:
Over the past 30 days, and our MVRV metric is indicating that a buy-low opportunity has arisen. While the average $BTC and $ETH trader is break-even in this time, $LINK trader returns are at -20% in this time span. Sentiment is low, FUD is rampant, and a rebound is more likely than not under these conditions. This metric is one of our top leading indicators.
Author

Rajarshi Mitra
Independent Analyst
Rajarshi entered the blockchain space in 2016. He is a blockchain researcher who has worked for Blockgeeks and has done research work for several ICOs. He gets regularly invited to give talks on the blockchain technology and cryptocurrencies.


