Chainlink Price Analysis: LINK goes through consolidation, preps for a breakout
- LINK has charted the bullish engulfing pattern in the 3-day chart.
- The MACD in the daily chart shows increasing bullish momentum.
-637336005550289133.jpg)
LINK/USD candlesticks have charted the bullish engulfing pattern in the 3-day chart.
-637369309323315250.png)
Over the last two sessions, LINK has risen from $7.60 to $10.68. Let’s check out the daily chart to see if LINK will sustain this bullish momentum or not.
LINK/USD daily chart
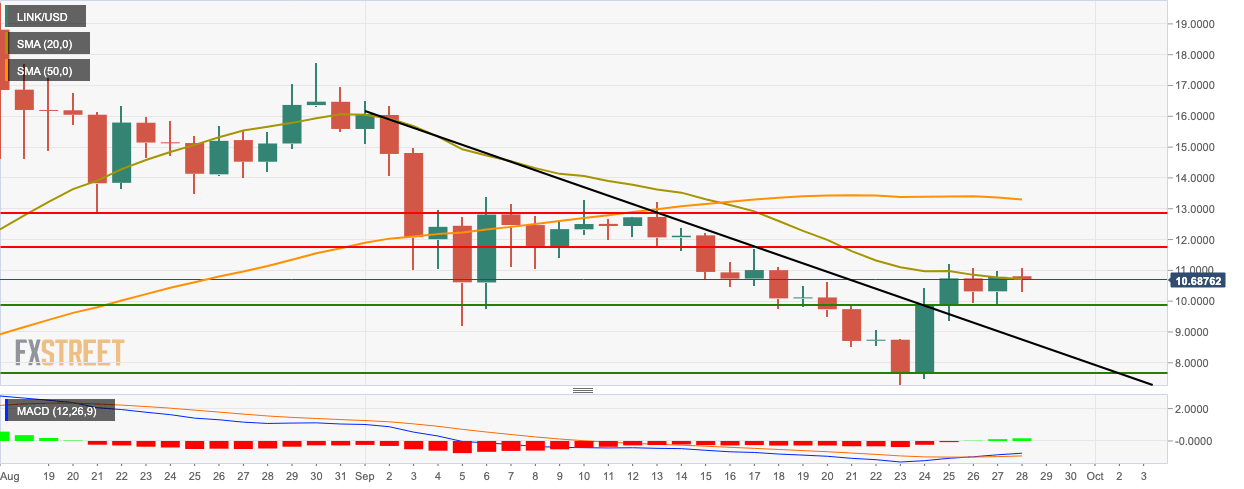
LINK broke above the downward trending line this Thursday and is currently trending horizontally between the $10 support line and the SMA 20 curve. This indicates that LINK is presently in a consolidation stage as the buyers aim to break the price above SMA 20. If the price breaks above SMA 20, the bulls will target the $11.75 and $12.85 resistance lines before they make a charge towards the SMA 50 curve. The MACD has shifted from bearish to bullish, which supports this narrative. However, if the bears successfully defend the SMA 20 curve, the price may drop below $10-level.
LINK IOMAP
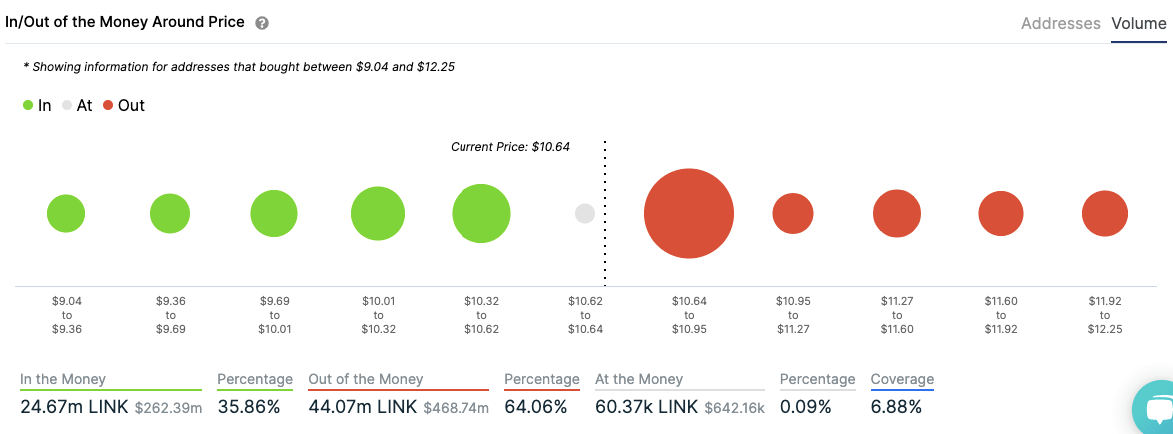
IntoTheBlock’s “In/Out of the Money Around Price” (IOMAP) model reveals that the price is sandwiched between strong resistance and support walls. This further supports our narrative that price is going through a consolidation period. Up top, the resistance wall lies at $10.80, wherein 1.89k addresses had previously purchased 29.39M LINK. If the bulls manage to gain enough momentum to break past this level, the rest of the levels shouldn’t be that much of a problem. On the downside, a healthy support barrier lies at $10.45, where 5.37k addresses had bought 9.14M LINK.
LINK New Addresses
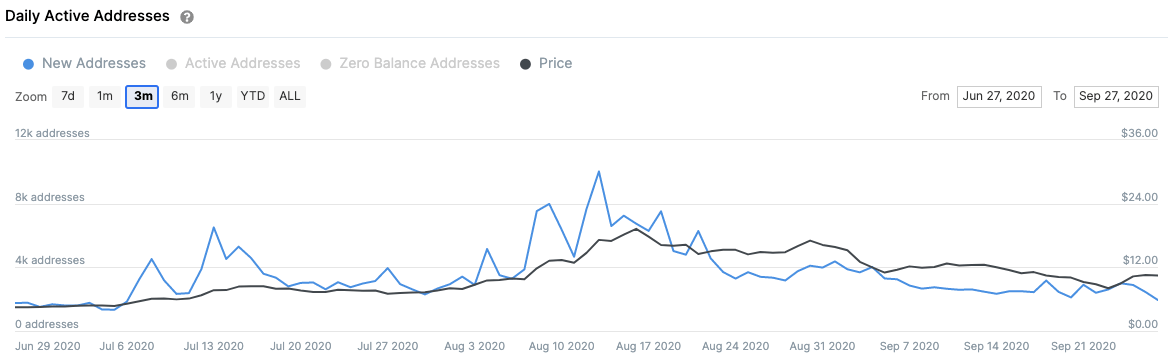
IntoTheBlock’s “Daily Active Addresses” model shows that the number of new addresses created on the Chainlink network topped-out on August 13, at a high of 10,020 addresses per day, calculated on a 3-month trailing average. Since then, Chainlink’s network growth has declined by new active addresses per day.
Only 1,940 new addresses were created at press time based on this trailing average, which can be considered a significant bearish sign for LINK.
Author

Rajarshi Mitra
Independent Analyst
Rajarshi entered the blockchain space in 2016. He is a blockchain researcher who has worked for Blockgeeks and has done research work for several ICOs. He gets regularly invited to give talks on the blockchain technology and cryptocurrencies.


