- Celestia's 176 million unlocked TIA tokens are causing FUD among investors.
- Taran Sabharwal clarified that not all unlocked tokens will immediately be available for sale.
- TIA could trigger a massive correction if it fails to bounce off the $4.506 support level.
Celestia (TIA) is down about 9% following increased negative sentiment surrounding its cliff unlock, which is worth about 176 million TIA tokens. The token could see a correction if it fails to bounce off the $4.506 level.
TIA unlock stirs FUD among investors
Celestia unlocked 176 million TIA on Wednesday in a cliff unlock representing 80% of its current supply.
Cliff unlocks are events where a crypto project releases vested tokens to investors, community members or advisors after a lockup period. It can lead to sharp price declines in a token if demand fails to catch up with the new supply.
Several crypto community members have expressed FUD (fear, uncertainty, and doubt) following the unlock, leading to TIA diving over 9% in the past 24 hours. The price decline stretched its weekly losses to 15.5%.
While investors expect more selling pressure in the coming days, Taran Sabharwal, CEO of Stix trading platform, clarified in an X post on Tuesday that not all 176 million unlocked TIA will immediately be available for sale.
He noted that Celestia has a 21-day unstaking period, and those who intended to sell their unlocked TIA tokens have already unstaked. Hence, the potential total TIA selling pressure from the unlock is 92.3 million TIA, which is approximately $460 million.
"What is also interesting here is that this accounts for <50% of the total cliff unlocks, which means that the sell pressure is half of what people have been expecting," Sabharwal added.
Celestia Price Forecast: TIA could face correction if it fails to bounce off key level
TIA has crossed below the convergence of its 50-day and 200-day Simple Moving Averages (SMAs) and is looking to test the $4.506 support level. A bounce off this level could see TIA aim to test the descending trendline resistance extending from June 3.
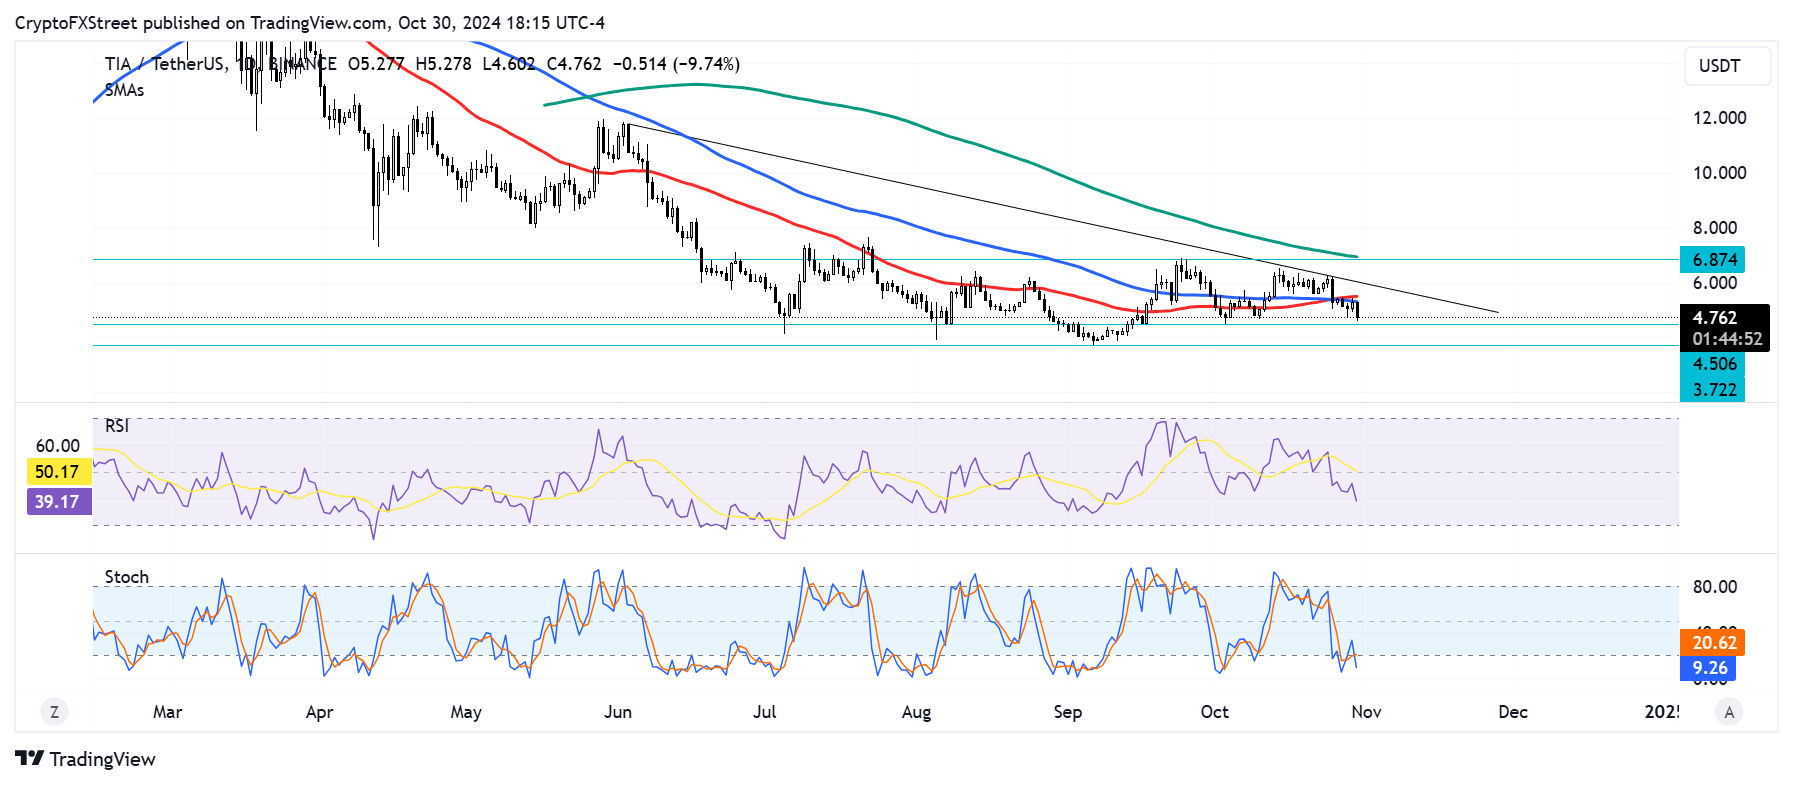
TIA/USDT daily chart
A sustained move above this level could see TIA rising toward $6.874, especially as the 50-day SMA is attempting a golden cross move above the 200-day SMA.
However, if the $4.506 support fails to hold, TIA could move toward $3.722. A daily candlestick close below this level will trigger massive sell pressure.
The Relative Strength Index (RSI) is trending downward below its midline and the Stochastic has entered its oversold region, indicating rising selling pressure.
Information on these pages contains forward-looking statements that involve risks and uncertainties. Markets and instruments profiled on this page are for informational purposes only and should not in any way come across as a recommendation to buy or sell in these assets. You should do your own thorough research before making any investment decisions. FXStreet does not in any way guarantee that this information is free from mistakes, errors, or material misstatements. It also does not guarantee that this information is of a timely nature. Investing in Open Markets involves a great deal of risk, including the loss of all or a portion of your investment, as well as emotional distress. All risks, losses and costs associated with investing, including total loss of principal, are your responsibility. The views and opinions expressed in this article are those of the authors and do not necessarily reflect the official policy or position of FXStreet nor its advertisers. The author will not be held responsible for information that is found at the end of links posted on this page.
If not otherwise explicitly mentioned in the body of the article, at the time of writing, the author has no position in any stock mentioned in this article and no business relationship with any company mentioned. The author has not received compensation for writing this article, other than from FXStreet.
FXStreet and the author do not provide personalized recommendations. The author makes no representations as to the accuracy, completeness, or suitability of this information. FXStreet and the author will not be liable for any errors, omissions or any losses, injuries or damages arising from this information and its display or use. Errors and omissions excepted.
The author and FXStreet are not registered investment advisors and nothing in this article is intended to be investment advice.
Recommended Content
Editors’ Picks

Crypto market wipes out $1 billion in liquidation as Asian markets bleed red
The crypto markets continue to decline on Monday, with Bitcoin (BTC) falling below $78,000. The Asian markets also traded in the red, with Japan’s stock market extending losses to 8.5%, its lowest level since October 2023.

XRP Price Prediction: XRP hangs on a loose thread, deeper correction below $2 impending?
Ripple (XRP) is extending losses below the previous week’s critical level at $2.00, as United States (US) President Donald Trump doubled down on tariffs, stressing that America must solve the trade deficit before making a deal.

Top 3 Price Prediction Bitcoin, Ethereum, Ripple: BTC and XRP head to yearly lows while ETH hits two-year bottom
Bitcoin (BTC) price hovers around $78,600 on Monday after falling nearly 5% the previous week. Ethereum (ETH) and Ripple (XRP) also followed in BTC’s footsteps and declined 13% and 10%, respectively, in the previous week.

Bitcoin could be the winner in the ongoing trade war after showing signs of decoupling from stocks
Bitcoin (BTC) traded above $84,000 on Friday, showing strength despite the stock market experiencing significant declines. The market reaction stems from United States (US) President Donald Trump's clash with the Federal Reserve Chairman Jerome Powell over interest rate decisions.

Bitcoin Weekly Forecast: Tariff ‘Liberation Day’ sparks liquidation in crypto market
Bitcoin (BTC) price remains under selling pressure and trades near $84,000 when writing on Friday after a rejection from a key resistance level earlier this week.

The Best brokers to trade EUR/USD
SPONSORED Discover the top brokers for trading EUR/USD in 2025. Our list features brokers with competitive spreads, fast execution, and powerful platforms. Whether you're a beginner or an expert, find the right partner to navigate the dynamic Forex market.