Cardano set for rally if symmetrical triangle breakout holds as support
- Cardano is retesting its key support level around $0.364; bullish momentum may continue if it holds.
- ADA’s long-to-short ratio is above one, supporting a bullish picture.
- A daily candlestick close below $0.342 would invalidate the bullish thesis.

Cardano (ADA) price edges higher on Tuesday following an over 6% drop the day before. ADA is retesting a key support level, and if it holds, Cardano’s price could rally ahead. On-chain data supports the bullish thesis, as more traders are betting on Cardano’s price to rise.
Cardano poised for a rally if key support level remains intact
Cardano price broke above a symmetrical triangle, a technical pattern formed by connecting multiple highs and lows with two converging trendlines (from the end of July to mid-September) on September 24 and rallied more than 10%. Since Saturday, ADA’s price has retraced and is approaching its key support at $0.364, where the breakout level of the symmetrical triangle and the 50-day Exponential Moving Average (EMA) roughly coincide, making it a key reversal point. At the time of writing on Tuesday, it trades slightly above at $0.380.
If the $0.364 level holds, ADA could rally 22% to retest its daily resistance at $0.444.
The Relative Strength Index (RSI) on the daily chart has declined but is currently pointing upward, trading at 56, indicating a slowdown of bullish momentum. For Cardano to bounce, the RSI should rise back above 60 for the bullish momentum to be sustained.
If bulls are aggressive, the overall crypto market outlook is bullish, and Cardano closes above $0.444, ADA could extend the rally by 32% to reach the technical target of the symmetrical triangle (obtained by measuring the distance between the first daily high and the first daily low and adding it to the breakout point) at $0.590.
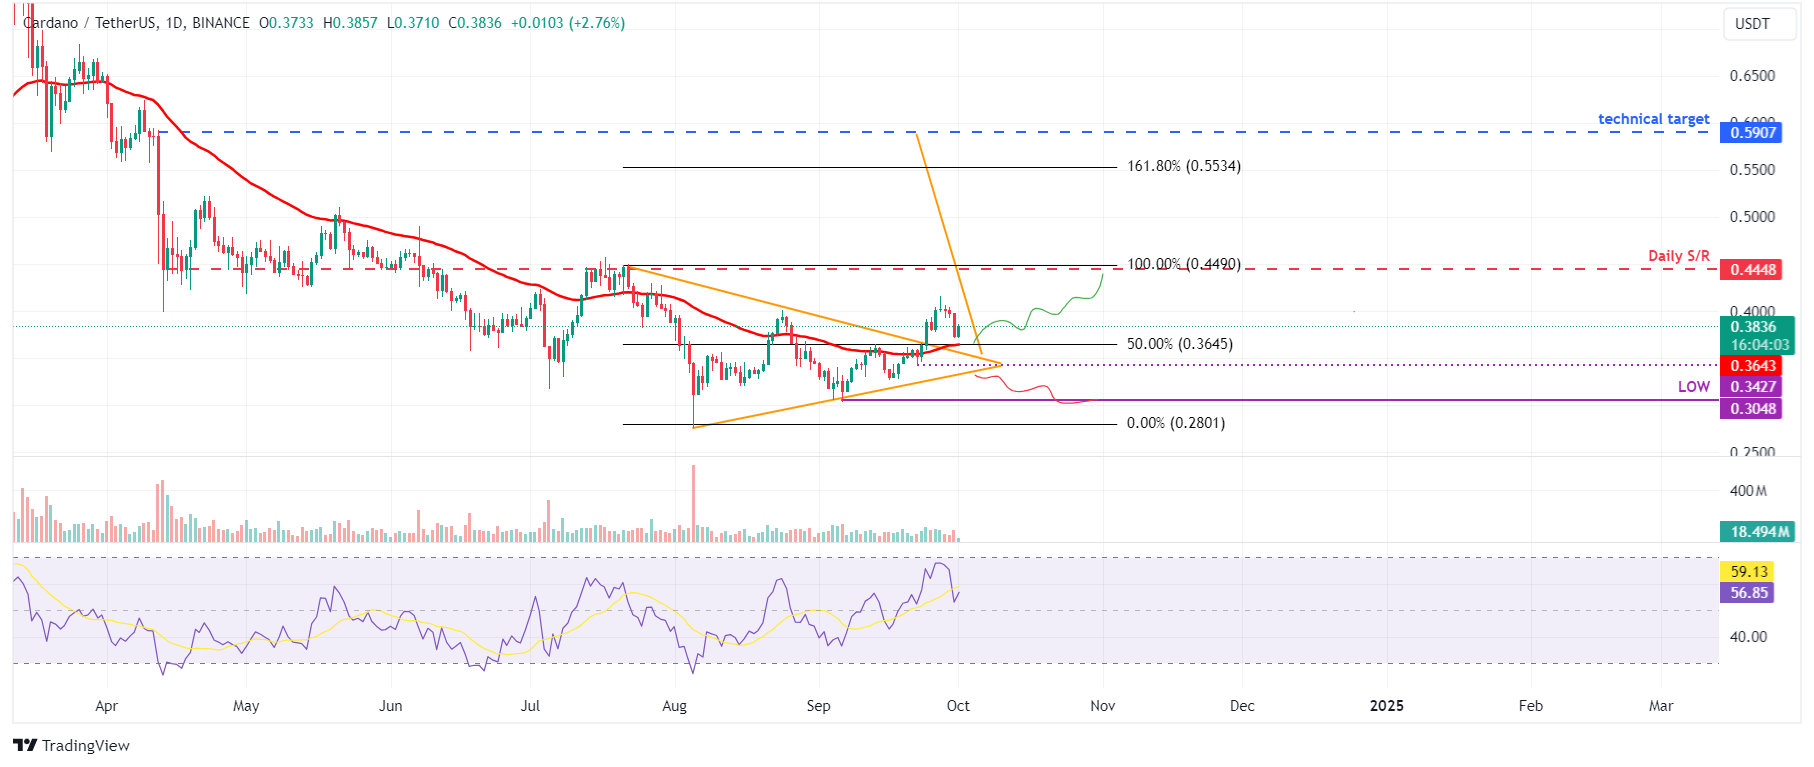
ADA/USDT daily chart
IntoTheBlock’s In/Out of the Money Around Price (IOMAP) further supports the bullish outlook. Nearly 133,350 addresses accumulated 1.25 billion ADA tokens at an average price of $0.376. These addresses bought the Cardano tokens for between $0.370 and $0.382, making it a key support zone.
From a technical analysis perspective, the $0.364 level roughly coincides with the IOMAP findings, making this zone a key reversal level to watch.
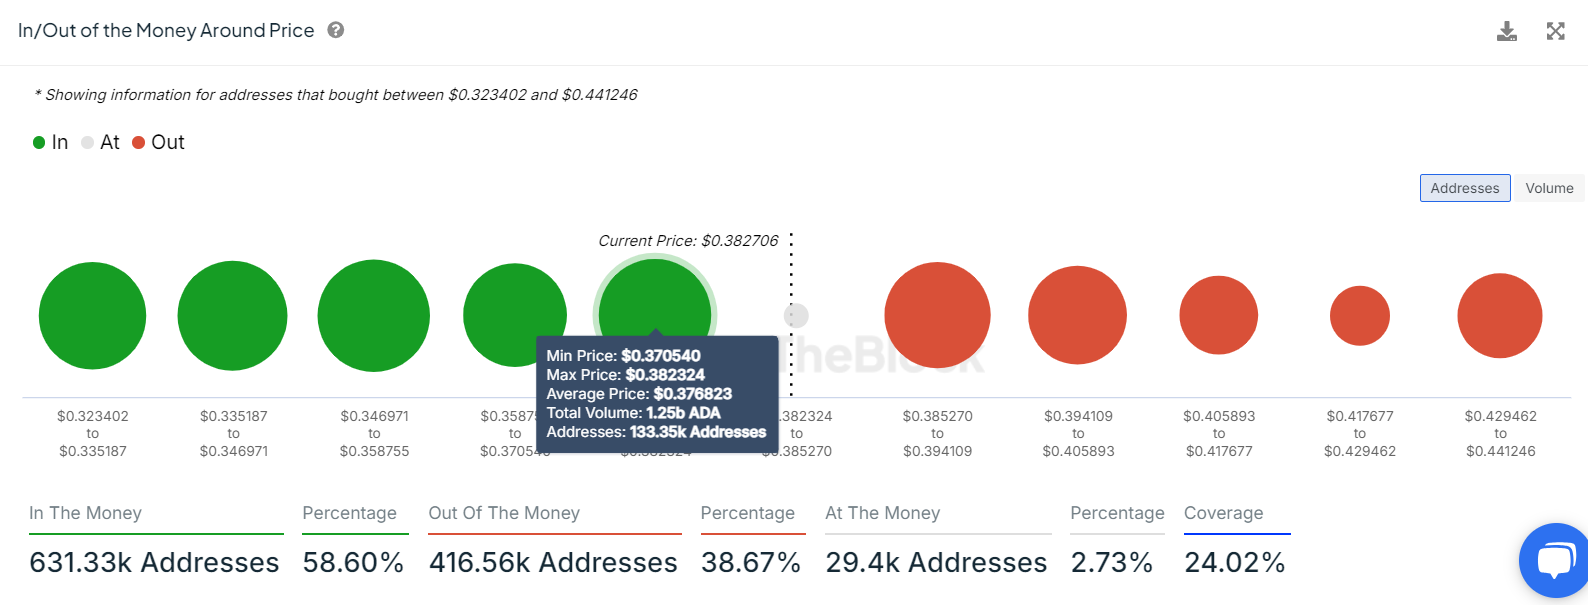
Cardano IOMAP chart
Moreover, Coinglass’s Cardano long-to-short ratio highlights the possibility of a bullish reversal. The ratio stands at 1.10, the highest level in over a month. This ratio reflects bullish sentiment in the market, as the number above one suggests that more traders anticipate the asset’s price to rise.
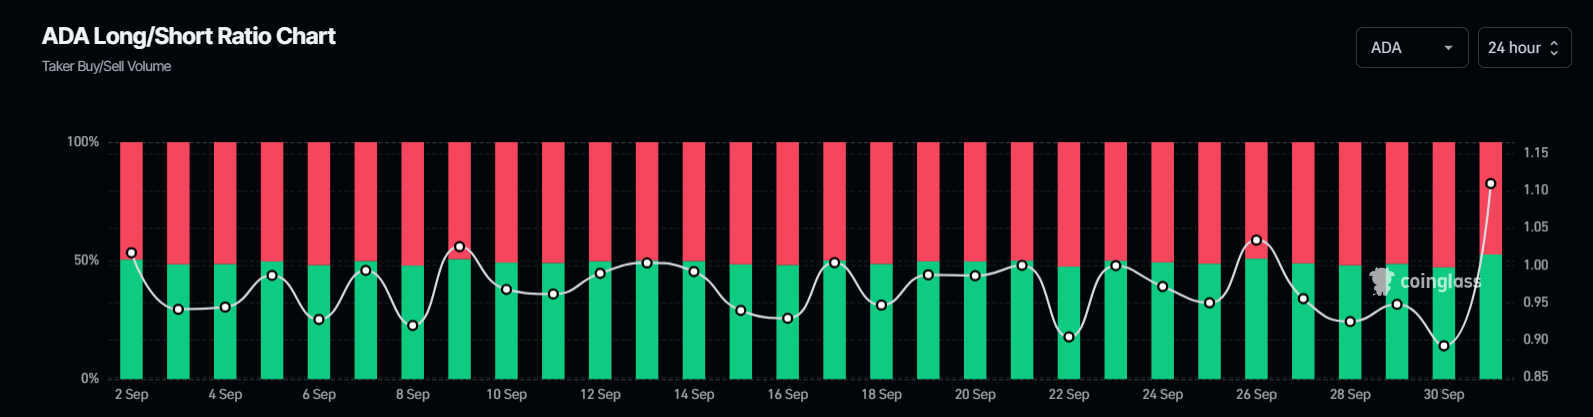
Cardano long-to-short ratio chart
Even though on-chain metrics and technical analysis support the bullish outlook, if ADA’s daily candlestick closes below $0.342, the bullish thesis would be invalidated by creating a lower low on the daily chart. This development could see Cardano’s price decline by 11% to retest its September 6 low of $0.304.
Author

Manish Chhetri
FXStreet
Manish Chhetri is a crypto specialist with over four years of experience in the cryptocurrency industry.


