Cardano tests key resistance, ready for rally if breaks above symmetrical triangle
- Cardano could rally if it breaks above the symmetrical triangle technical pattern it is trading within.
- On-chain data paints a bullish picture as ADA’s dormant wallets are in motion and open interest is rising.
- A daily candlestick close below $0.304 would invalidate the bullish thesis.
Cardano (ADA) price trades within a symmetrical triangle on Friday, a breakout from which could signal a rally ahead. ADA’s rising open interest further supports the bullish thesis, as do the recent movements seen in previously dormant wallets.
Cardano price shows potential for upward momentum
Cardano price trades inside a symmetrical triangle, a technical pattern formed by connecting multiple high and low levels with two converging trendlines (from the end of July to mid-September). This technical pattern has a bullish bias, and the target is generally obtained by measuring the distance between the first swing high and the first swing low to the breakout point. As of Friday, Cardano trades at $0.354, approaching the upper trendline of the triangle.
Assuming the breakout happens by closing a daily candlestick above the daily resistance level at $0.360, adding the 65% measurement to the potential breakout level of $0.360 reveals a target of $0.595. Investors should be cautious of this theoretical move as it could face a slowdown after an 18% rally to retest Cardano’s daily resistance level of $0.424 as traders could opt to book profits.
The Moving Average Convergence Divergence (MACD) momentum indicator on the daily chart supports Cardano’s rise. The MACD line (blue line) has crossed above the signal line (yellow line), giving a buy signal. It shows rising green histogram bars above the neutral zero line, suggesting that Cardano price could experience upward momentum.
Furthermore, the Relative Strength Index (RSI) trades at 55, above its neutral level of 50, and points upwards. A cross to levels over 60 would indicate that bullish momentum is gaining traction.
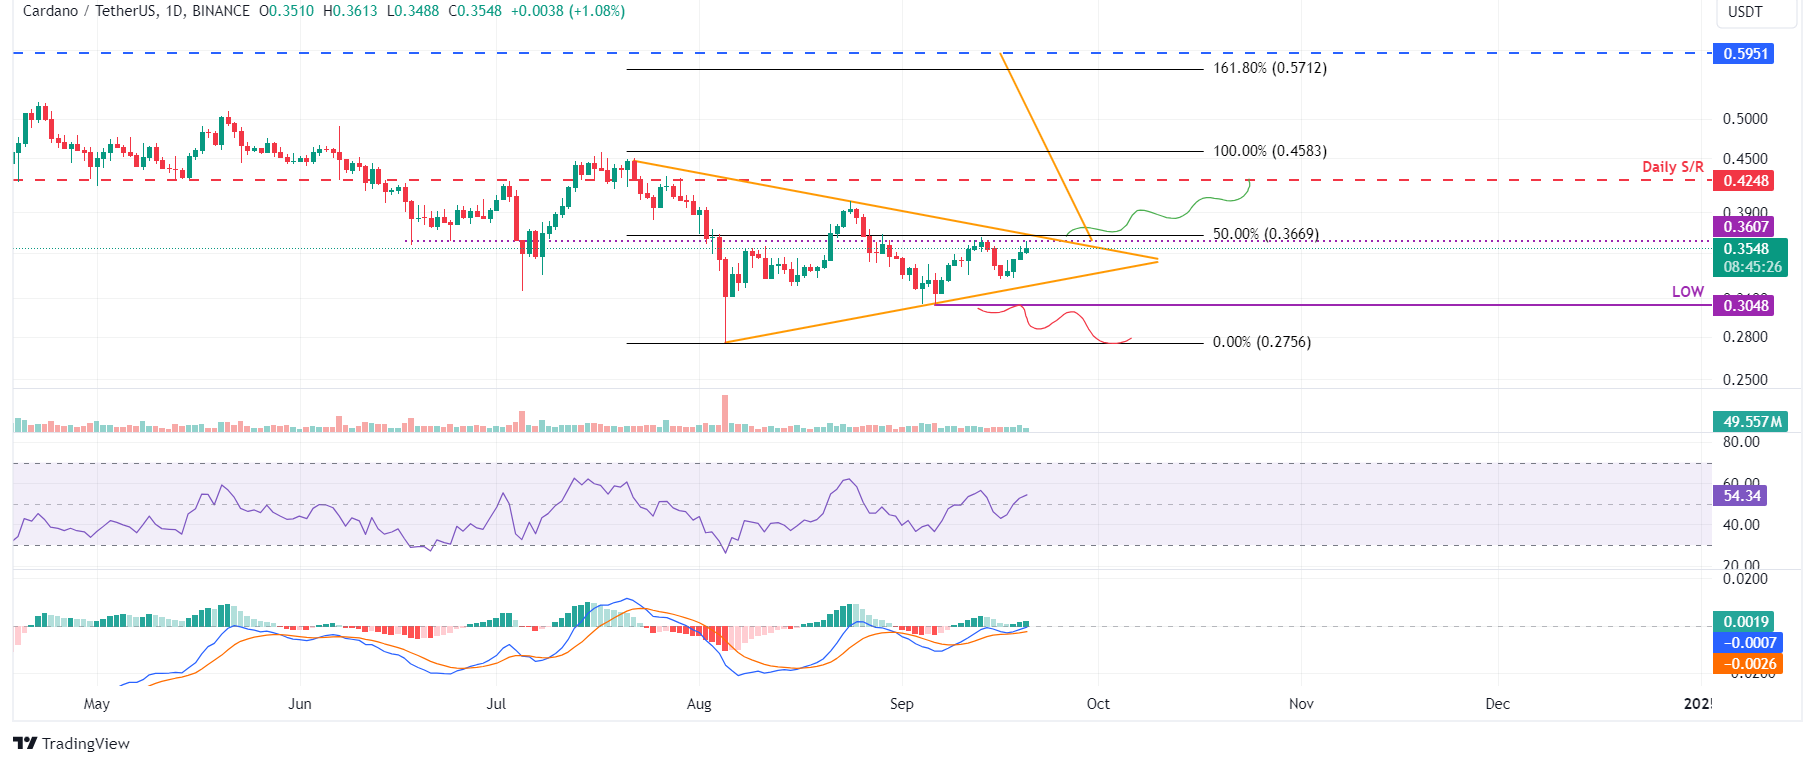
ADA/USDT daily chart
Cardano’s on-chain data further supports the bullish thesis. Coinglass’s data shows that the futures’ Open Interest (OI) in Cardano at exchanges is also increasing. The OI indicates the total number of outstanding derivative contracts that have not been settled (offset by delivery) and whether money flows into the contract are increasing or decreasing.
Increasing OI represents new or additional money entering the market and new buying, which suggests a bullish trend. On the contrary, when OI decreases, it is usually a sign that the market is liquidating, more investors are leaving, and prices may be going down.
The graph below shows that ADA’s OI increased from $185.56 million on Monday to $203.25 million on Friday, the highest level in over a month. This rise indicates that new or additional money is entering the market and new buying is occurring.
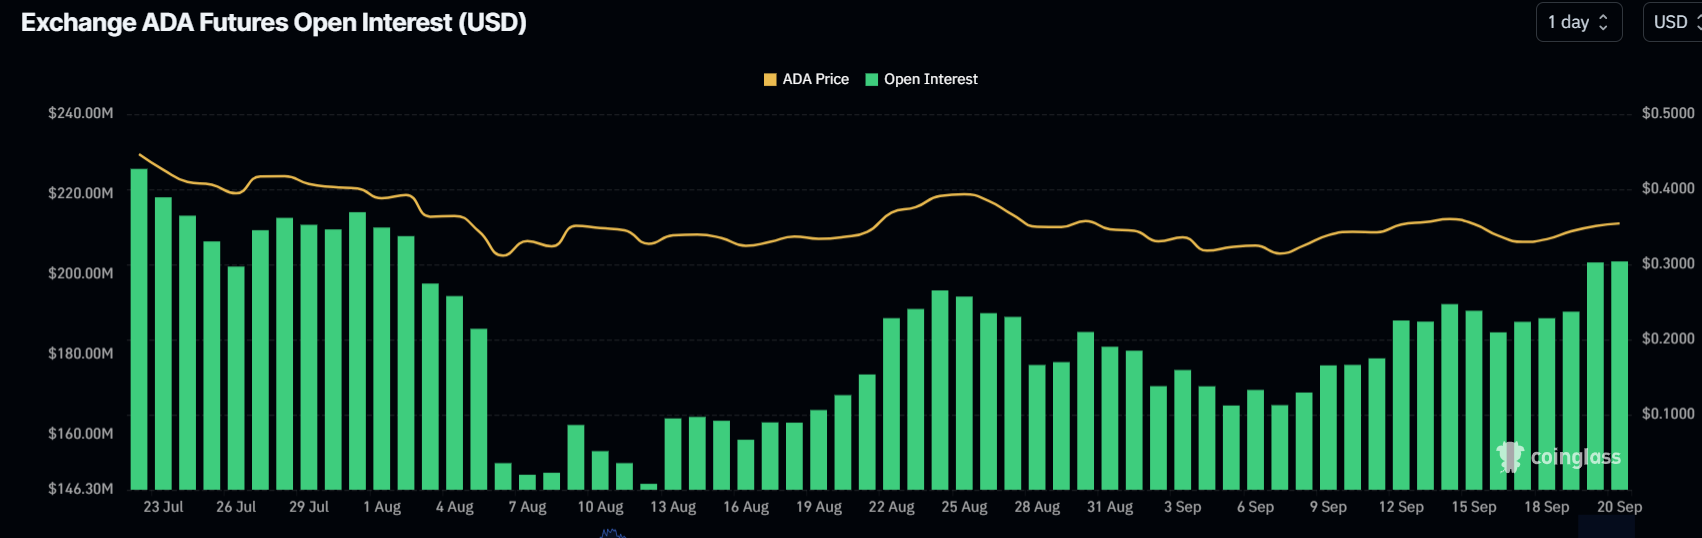
ADA Open Interest chart
Additionally, Santiment’s Age Consumed index aligns with the bullish outlook. The spikes in this index suggest dormant tokens (tokens stored in wallets for a long time) are in motion. These moves can be used to spot short-term local price tops or bottoms.
For ADA, history shows that those spikes were followed by a rally in prices. The most recent uptick seen on September 18 also forecasted that Cardano was ready for an uptrend.
%20[18.13.37,%2020%20Sep,%202024]-638624421587413532.png)
ADA Santiment’s Age Consumed Index chart
However, If Cardano’s daily candlestick breaks below the lower trendline and closes below $0.304, it would form a lower low on the daily time frame, thus invalidating the bullish thesis. This could lead to further 9% losses for Cardano to retest its September 6 low of $0.275.
Author

Manish Chhetri
FXStreet
Manish Chhetri is a crypto specialist with over four years of experience in the cryptocurrency industry.


