Cardano price strikes a new rally attempt, may finally solve the ADA riddle
- Cardano price has climbed 31.77% since July 21, but it has been a rally marked by huge intra-day swings and the empathic resistance of the 2018 high.
- ADA daily Relative Strength Index (RSI) has not reached an overbought reading, proposing more upside.
- Digital token releasing from a symmetrical triangle and triggering a bullish Golden Cross on the six-hour chart.

Cardano price fell -4.66% in July and failed to close above the 2018 high of $1.40. Due to the active head-and-shoulders pattern and the resilience of the 2018 high, the ADA outlook is still mixed. However, the emergence of a symmetrical triangle breakout combined with a Golden Cross on the six-chart improves the opportunity for a daily close above $1.50 and a transition from rally to advance.
Cardano price is golden, looks for a strong bid
Cardano price may provide a clue on the six-hour chart as the bullish Golden Cross pattern coincides with a symmetrical triangle breakout. It is the first Golden Cross pattern since the launch of the remarkable ADA rally in November 2020.
The measured move of the symmetrical triangle is 13.61%, projecting a Cardano price target of $1.57. The move may be insignificant, but it would void the head-and-shoulders pattern and confirm the ADA transition from rally to advance.
The only visible obstacle is that the breakout and Golden Cross are triggering as Cardano price tests the 2018 high again.
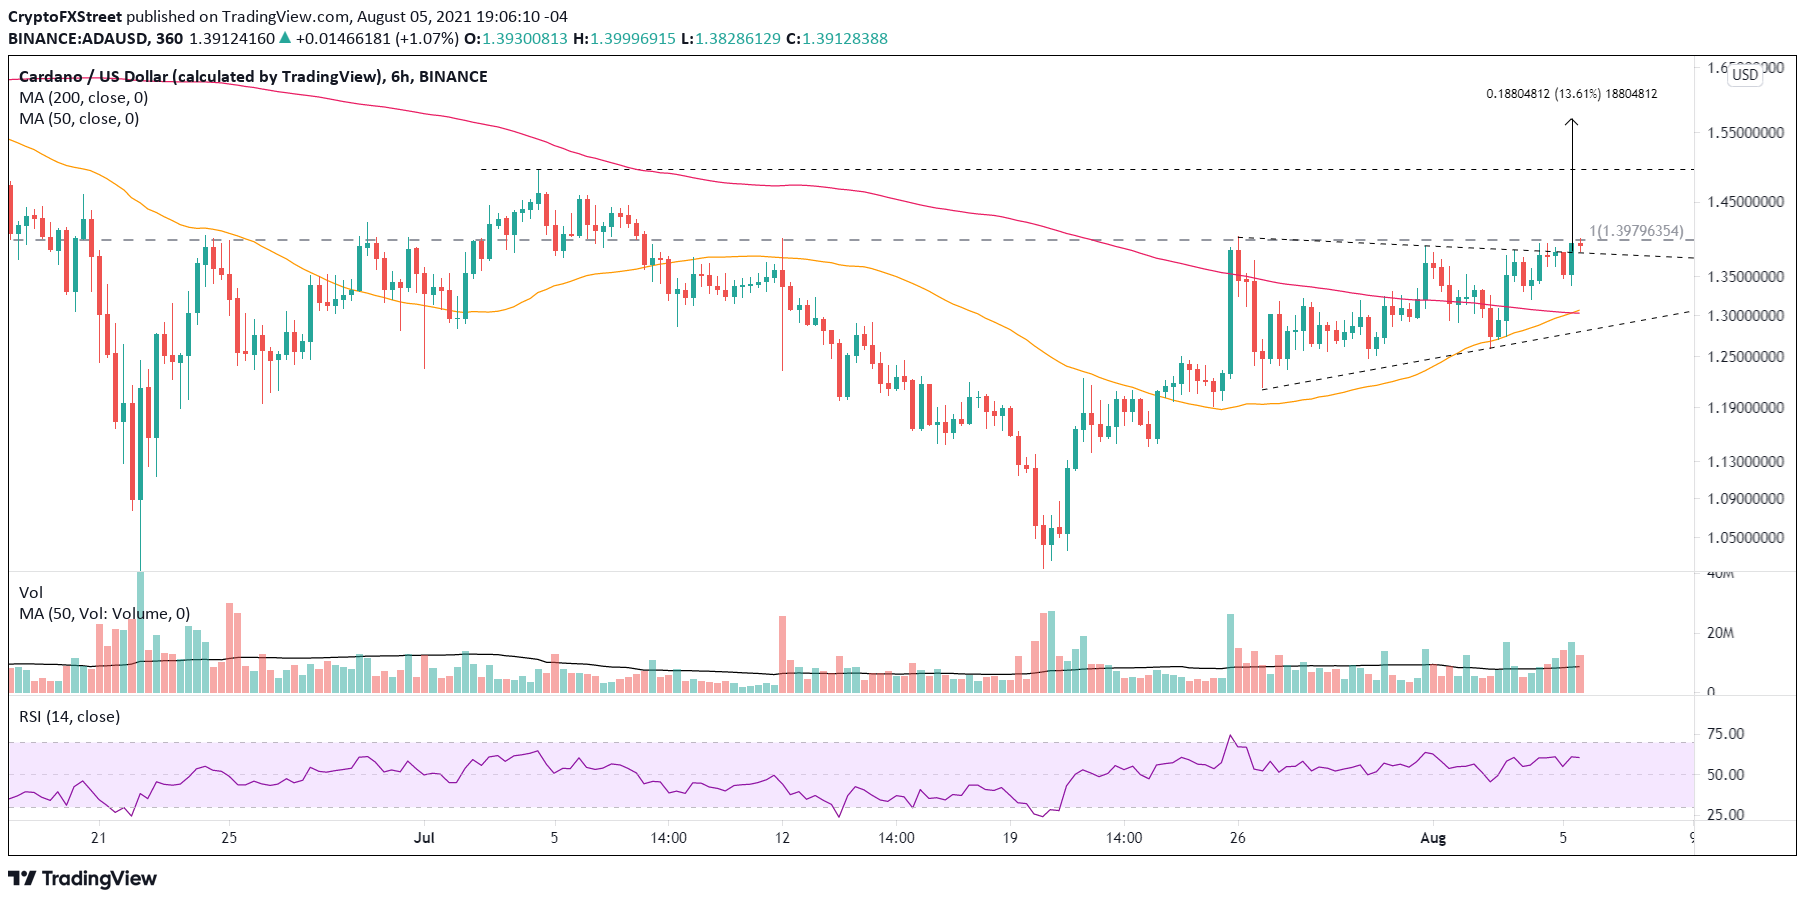
ADA/USD 6-hour chart
On a daily chart, the head-and-shoulders pattern is revealed with a measured move of 60% and a Cardano price target of $1.37 based on the 61.8% Fibonacci retracement level of the advance from the March 2020 low as the neckline. A collapse of that size would easily dismantle the support at the 50-week simple moving average (SMA) at $0.78 and knock ADA below the April 2018 high of $0.41.
Thus, the clarity offered by the six-hour chart is fundamental in solving the Cardano price riddle in the coming hours or days. A continuation of the breakout from the symmetrical triangle, strengthened by the Golden Cross, may generate the price momentum to close ADA above the right shoulder at $1.50 and permanently fracture the resistance of the 2018 high of $1.40.
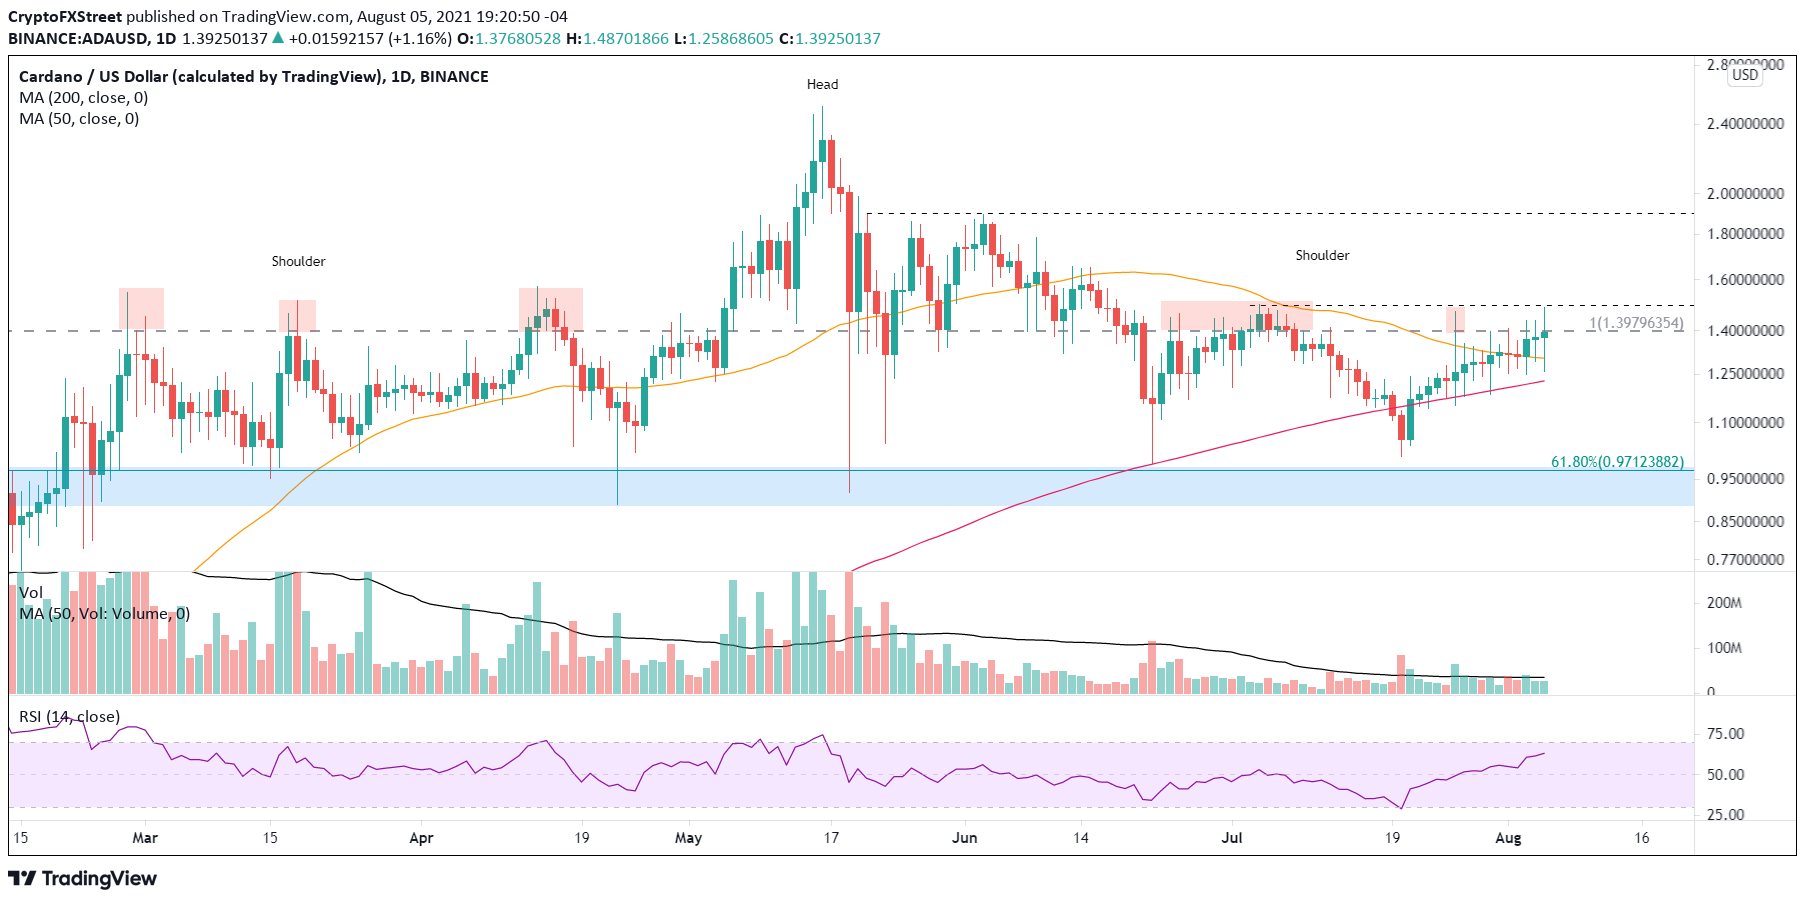
ADA/USD daily chart
At this point, it is all about follow-through for Cardano price. A continuation of the symmetrical triangle breakout and a daily close above $1.50 may finally repair the ADA price structure that has confounded investors since the May crash.
Here, FXStreet's analysts evaluate where ADA could be heading next as it seems bound to advance further.
Author

Sheldon McIntyre, CMT
Independent Analyst
Sheldon has 24 years of investment experience holding various positions in companies based in the United States and Chile. His core competencies include BRIC and G-10 equity markets, swing and position trading and technical analysis.


