Cardano price action and on-chain metric collide, reveals a complex situation for ADA
- Cardano price closed last week with a 6.89% gain after failing to hold gains above the 2018 high of $1.40.
- ADA has shaped a head-and-shoulders pattern with a measured move of approximately 60%.
- IOMAP metric indicates that the digital token faces limited resistance (out of the money addresses) to claiming the 2018 high.

Cardano price staged a rebound in July after dropping near the 38.2% Fibonacci retracement at $0.971, marking the fifth consecutive month of a bullish reversal from the level. Despite another bullish reversal, the ADA outlook remains mixed with the 2018 high still inflicting heavy resistance on breakout attempts. Only a daily close above $1.498 would transition the outlook to moderately positive.
Cardano price cannot discover follow-through
Cardano price has climbed 30.25% since July 21 after the daily Relative Strength Index (RSI) registered an oversold reading for the first time since September 2020. The 30.25% gain is on the lower end of the performance spectrum for altcoins, but it has positioned ADA again at the 2018 high of $1.40. Moreover, it ensured the fifth consecutive month of support around the 61.8% retracement level.
Also, note in the monthly chart below that Cardano price has failed to record a monthly close above the 2018 high on five of the past six months, despite trading above at some point. Further technical evidence of the roadblock that confronts ADA.
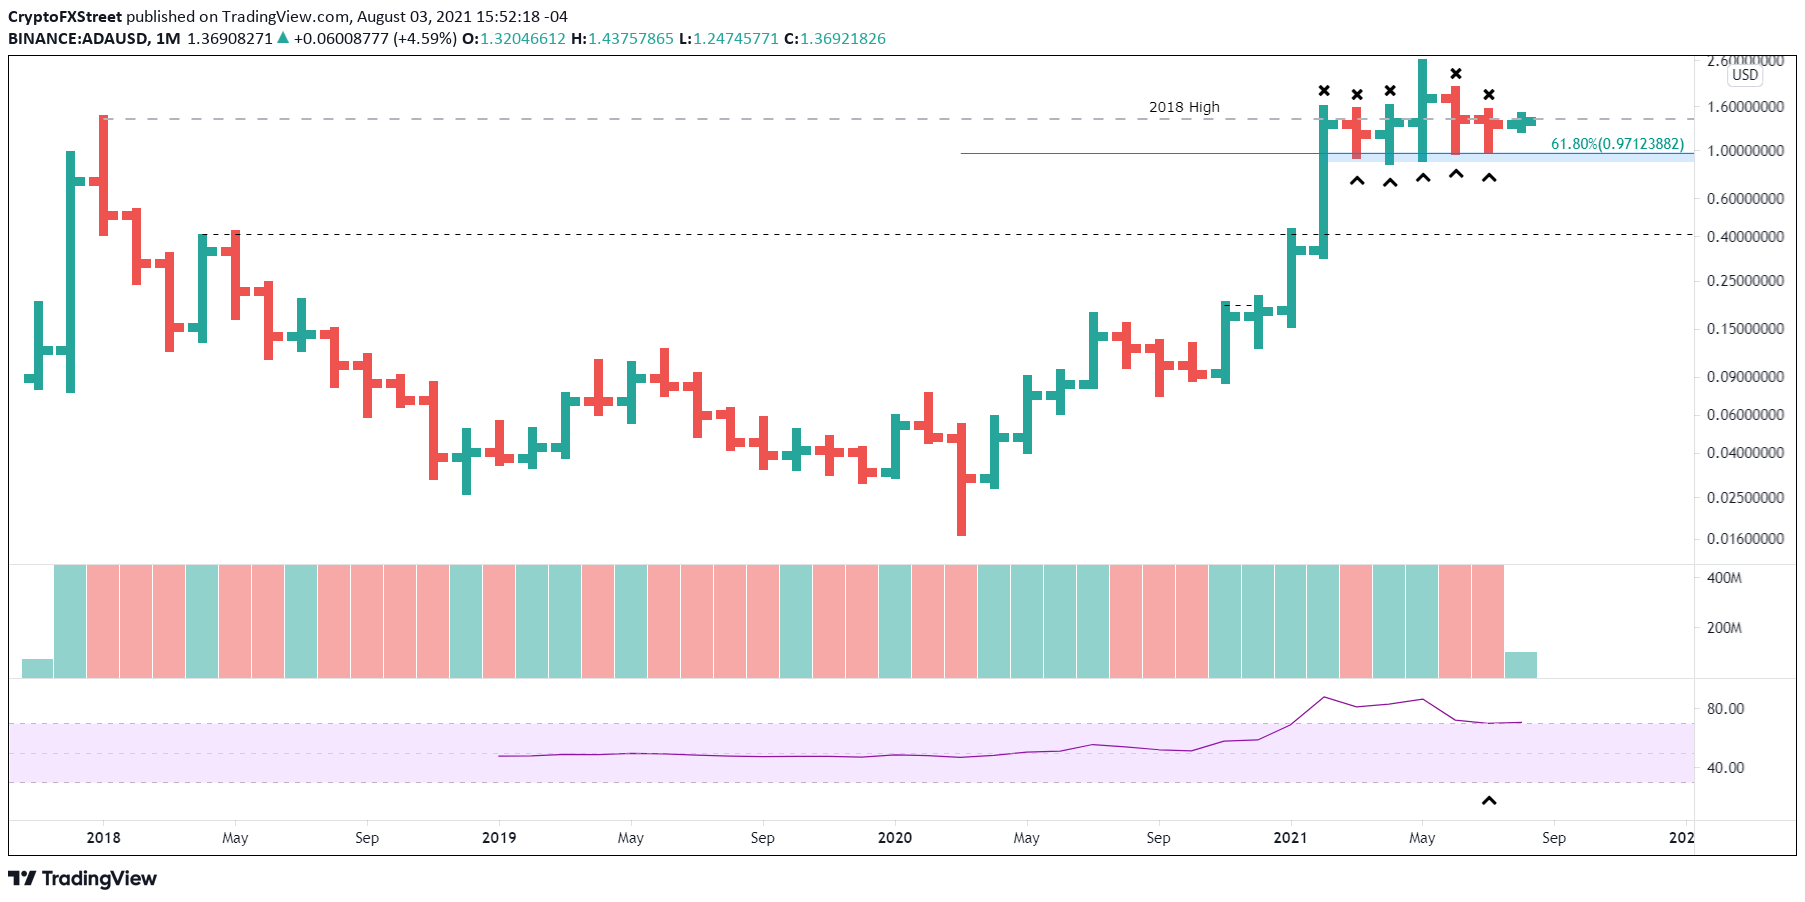
ADA/USD monthly chart
The rebound has clarified the Cardano price structure, introducing a head-and-shoulders pattern with a measured move of just over 60% and a price target of $0.375 based on the 61.8% retracement level of the advance from the March 2020 low as the neckline. A drop of that magnitude would undermine support at the 50-week simple moving average (SMA) at $0.784 and press ADA below the April 2018 high of $0.410.
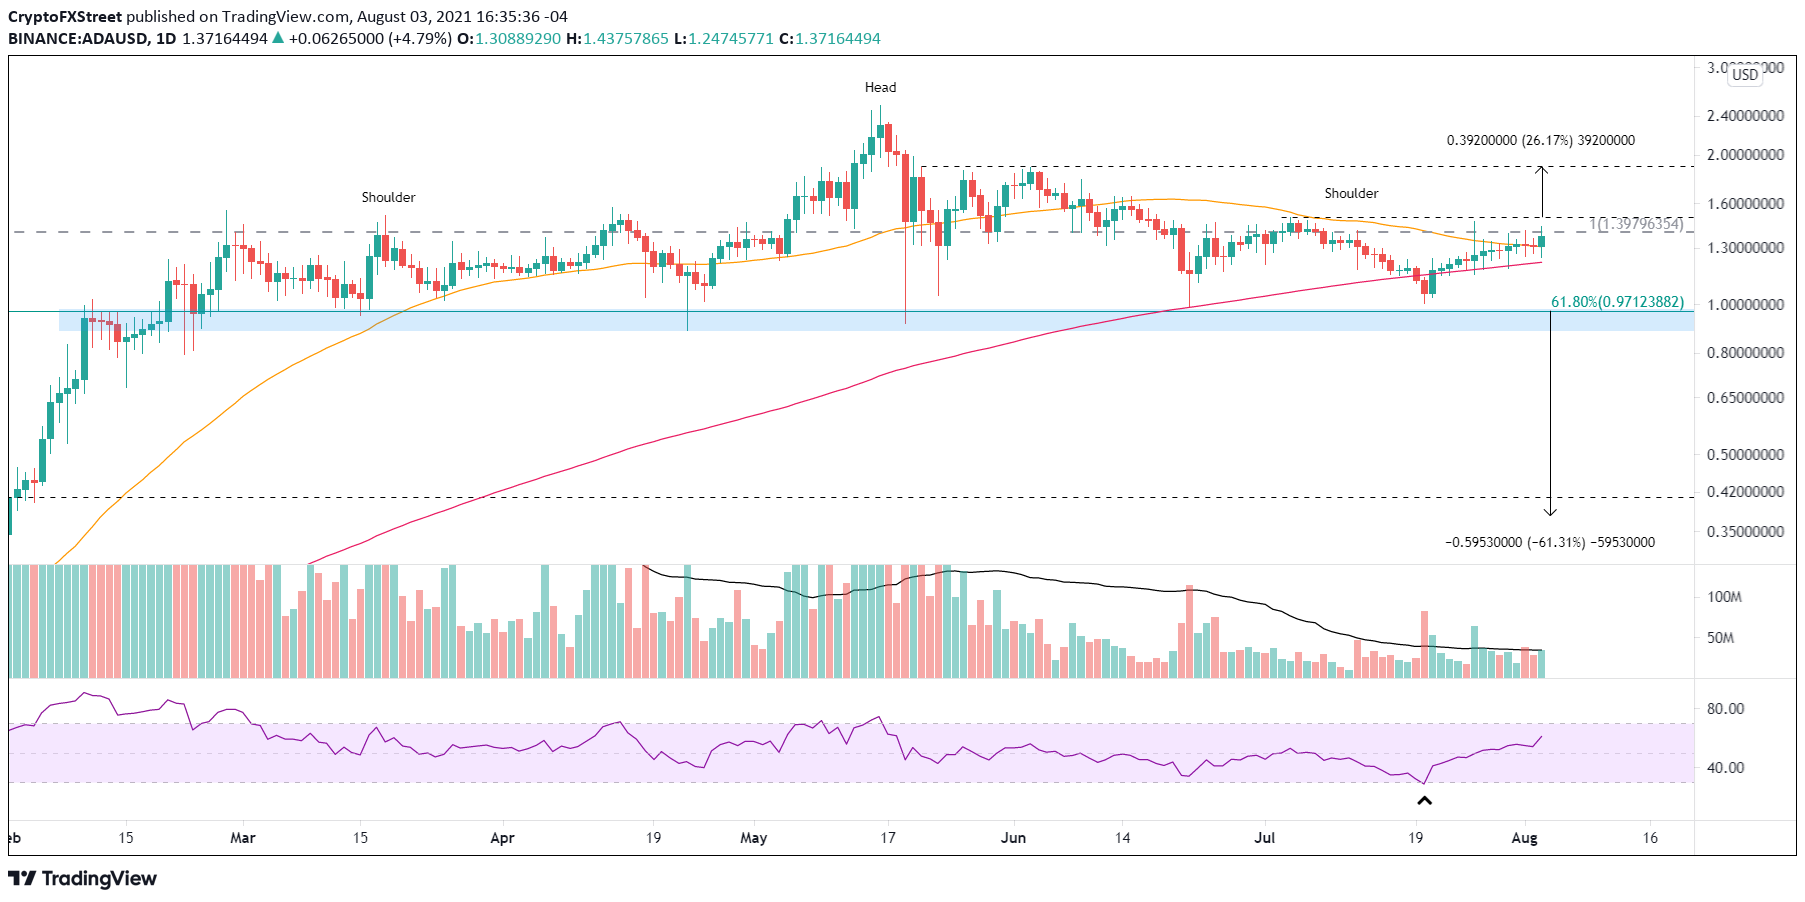
ADA/USD daily chart
A positive outlook would emerge with a daily close above the July 4 high of $1.49. As a result, Cardano price would be exposed to the potential for an ADA rally to the first notable layer of resistance around $1.89, which yields a 26% gain from the July 4 high.
Even so, the question remains whether Cardano price can hold the gains into the month's close, thereby forcing a conservative trading posture.
With the 2018 high serving as the enemy of Cardano price, it is interesting to note that the IntoTheBlock In/Out of the Money Around Price (IOMAP) metric reveals minor resistance to $1.58. The cluster between $1.38 to $1.42 shows just 51.8k addresses (out of the money) holding 510.66 million ADA at an average price of $1.40. It is not the type of weight that the charts seem to indicate.
There is a slight bump up in out of the money addresses between $1.42 and $1.46, but again, it is minor compared to the heavy support (in the money addresses) from $1.37 to $1.17.
Overall, the IOMAP suggests that Cardano price is poised to tackle the 2018 high and the July 4 high of $1.498 with relative ease.
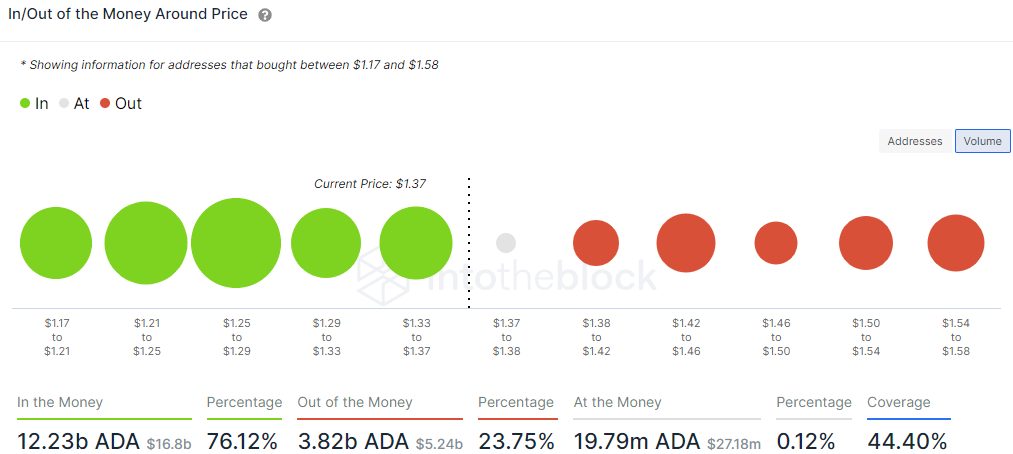
ADA IOMAP - IntoTheBlock
The on-chain metric IOMAP marks a bullish departure from the bearish technicals displayed on various timeframes. Nevertheless, until Cardano price can show follow-through and log a close above the July 4 high, the short-term outlook remains neutral-to-bearish as the head-and-shoulders pattern carries serious bearish implications for ADA.
Author

Sheldon McIntyre, CMT
Independent Analyst
Sheldon has 24 years of investment experience holding various positions in companies based in the United States and Chile. His core competencies include BRIC and G-10 equity markets, swing and position trading and technical analysis.


