|

Cardano Price Prediction: Patience will save you from heartbreak

  • Cardano price, like other cryptocurrencies, coils in a triangular fashion.
  • ADA  price sees rejection from both the 8- & 21-day simple moving averages.
  • Invalidation of the downtrend is a breach above $0.48.

Cardano price could experience another sell-off. The swing lows established in June are unstable. Traders should also be hesitant to use the  swing low on May 12 as a bullish invalidation level.

Cardano price looks like a smart money trap

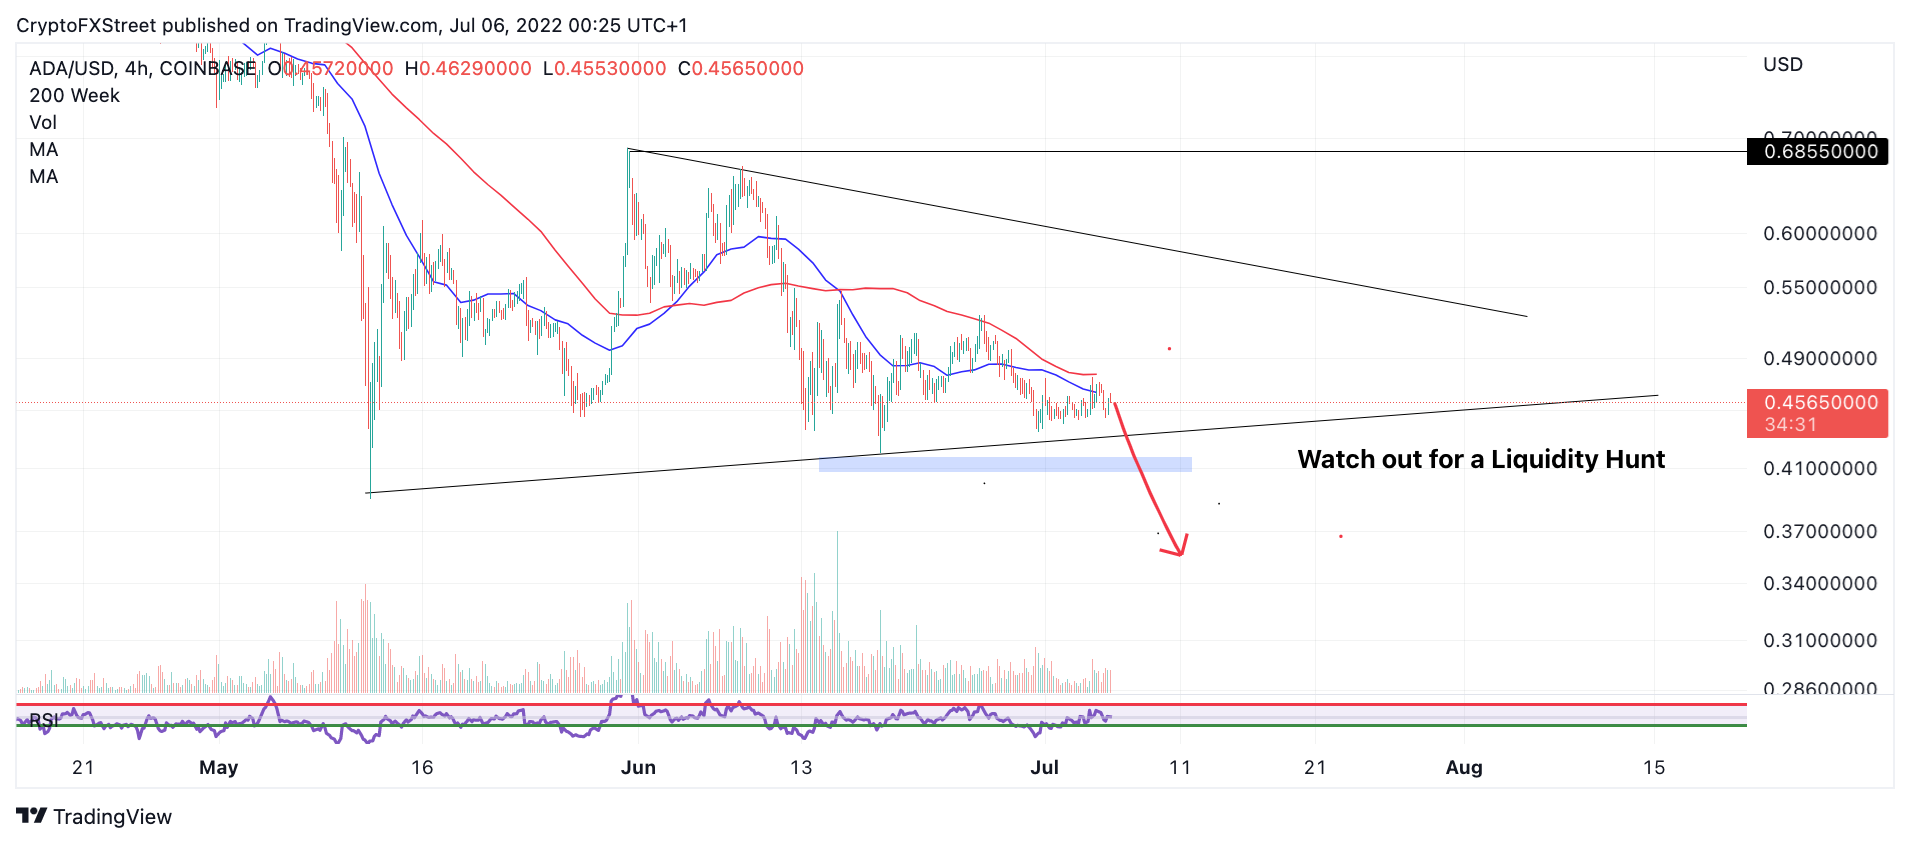
Cardano price looks like it is setting up for a "sweep the lows" event targeting a retest of the $0.40 barrier and possibly the May 12 swing low at $0.39. Like many other cryptocurrencies in the market, the alternative-smart contract token coils in a triangular fashion. However, unlike its peers, the ADA price never established a progressive rally throughout the last weeks of June. 

Cardano price has been trading range bound within the mid-$0.40 zone for the last 23 days. Its recent sideways nature only pales in comparison to USD stablecoins.

Cardano price currently trades at $0.456. On July 4, 2022, the bears successfully rejected the ADA price beneath the 8- and 21-day simple moving averages (SMA). ADA price could induce traders to open an unjustified long position, believing that the triangular pattern will continue to hold. 

An additional retest of the $0.43 barrier could become the catalyst to breach the swing lows established in June at $0.42. Furthermore, attempting to catch a knife in the $0.41 region while using the June 12 swing lows at $0.39 is ill-advised. Ultimately, this thesis concludes that a plummet to $0.37 and lower will be unsurprising.
tm/ada/7/5/22

ADA/USDT 4-Hour Chart

Invalidation of the bearish trend lies above the 21-day SMA at $0.48. If the bulls can reconquer this resistant barrier, they may be able to rally as high as $0.60, resulting in a 32% increase from the current ADA price. 

Author

Tony M.

Tony M.

FXStreet Contributor

Tony Montpeirous began investing in cryptocurrencies in 2017. His trading style incorporates Elliot Wave, Auction Market Theory, Fibonacci and price action as the cornerstone of his technical analysis.


More from Tony M.
Share:

Editor's Picks

Bitcoin Price Forecast: BTC extends pullback as profit-taking weighs
Bitcoin (BTC) trades below $84,000 at the time of writing on Thursday, extending the pullback for the third consecutive day as profit-taking weighs in. Despite the price correction, strong institutional demand alongside sustained accumulation by the 100–1,000 BTC holder cohort could support the Crypto King.
XRP is flashing three bullish signals heading into a historically weak October
XRP (XRP) is still flashing 3 bullish signals across its holders, derivatives, and ETF data. These signals come as the token gave back part of its September gains on Thursday. The token traded near $1.50 at press time, down about 6.3% over 24 hours, according to BeInCrypto Markets data. The pullback still leaves XRP up over 15.6% on the week, a gain that tracks a broader market rally.
Crypto Today: Bitcoin, Ethereum, and Ripple – Bulls start to lose control
Bitcoin (BTC), Ethereum (ETH), and Ripple (XRP) are trading in the red on Thursday after losses of 2% to 4% the previous day. The major cryptos are starting to lose bullish control in the near term so far this week, despite the institutional funds witnessing steady inflows. The technical outlook for Bitcoin, Ethereum, and Ripple indicates near-term downside risk.
Litecoin token has its moment as network activity booms
Litecoin, the cryptocurrency considered silver to Bitcoin's gold, and one that's often missing from day-to-day crypto discussions, has bucked the broader market weakness over the past 24 hours. LTC currently ranked 24th largest by market cap, has gained nearly 8% to $66 in 24 hours, the highest since January.
Bitcoin: BTC shrugs off CLARITY Act setback and hawkish Fed
Bitcoin (BTC) price action has remained resilient this week, trading above $78,000 at the time of writing on Friday, heading toward a key resistance zone. Institutional demand shows early signs of weakness, with spot Exchange Traded Funds (ETFs) on track for a second straight week of outflows, with over $420 million recorded through Thursday amid escalating Middle East tensions.