Cardano price not ready for all-time high, as ADA at technical crossroads
- Cardano price rallies into the convergence of two significant resistance levels.
- Volume sluggish, suggesting a lack of conviction.
- Daily Relative Strength Index (RSI) does not reach an oversold reading.

Cardano price has recovered part of the 40% decline, but the combination of the symmetrical triangle’s lower trend line and the 2018 high may ambush the advance. A neutral outlook is an optimal approach with ADA until it springs into new highs.
Cardano price seeks continuity, but needs a catalyst
On April 14, ADA spoofed bullish speculators with a bull trap. A breakout above the triangle’s upper trend line was quickly sold, pushing the cryptocurrency back into the pattern. A few days later, it slashed below the lower trend line and went on to decline close to 30% while overwhelming the 10-week simple moving average (SMA) and finally discovering support at the 100-day SMA.
On a daily timeframe, as seen in the chart below, it is evident that ADA requires a catalyst to shake loose of the determined resistance around $1.40. In the meantime, the outlook prescribes some patience for speculators looking to enter a new trade. There is absolutely no reason to go long at these levels. Instead, wait for a daily close above the April high at $1.57.
A successful breakout can look forward to a test of the 161.8% Fibonacci extension of the April decline at $2.23 and, potentially, a meeting with the 261.8% extension at 3.92.
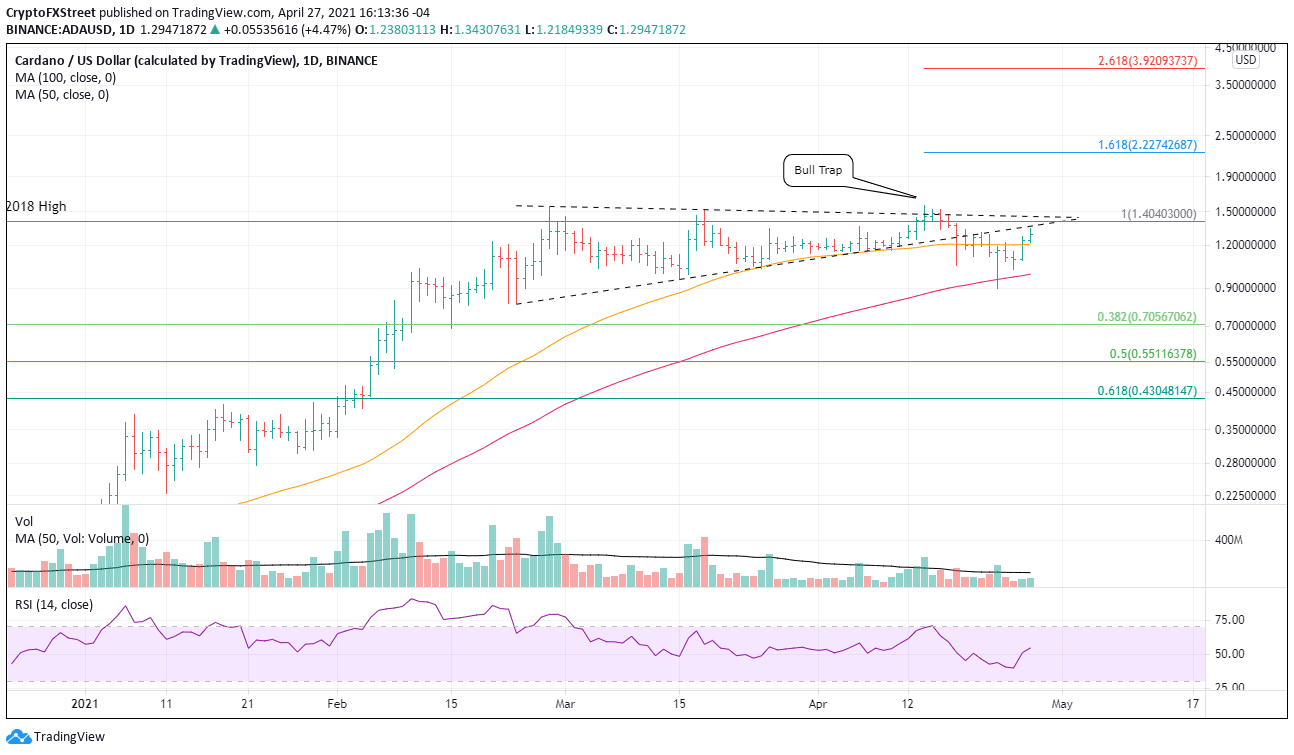
ADA/USD daily chart
Now, if the lack of commitment, demonstrated by the low volume supporting the two-day rally, portends the future, market operators should be wary of a resumption of the decline. There will be some support at the 50-day SMA at $1.21, but they should give more attention to the 100-day SMA at $0.99. A close below the April low of $0.89 opens another kettle of fish that could evolve into a decline to the 38.2% retracement of the 2021 advance
Author

Sheldon McIntyre, CMT
Independent Analyst
Sheldon has 24 years of investment experience holding various positions in companies based in the United States and Chile. His core competencies include BRIC and G-10 equity markets, swing and position trading and technical analysis.