Cardano price: Key ADA dynamics to watch out as Ethereum-killer climbs higher
- Cardano developers announced a new release for Hydra, ADA’s layer-2 scalability solution.
- Ethereum-killer Cardano recovered from its decline on October 26 and yielded 16% gains for ADA holders over the past week.
- Analysts believe Cardano is likely to continue its rally and hit the $0.431 level if the altcoin sustains its uptrend.

Cardano blockchain’s solution for scalability, Hydra received a fresh update in a new prerelease version. The Ethereum-killer recovered its losses from past week and analysts revealed a bullish outlook on Cardano.
Also read: This is the biggest pain point for Bitcoin and Ethereum in the current cycle
Hydra receives new release from Cardano developers
Cardano’s scalability solution Hydra received a new update Hydra 0.8.0, from ADA developers. Sebastian Nagel, Hydra’s lead developer shared a GitHub release introducing several changes to the API, fixed bugs in the Hydra-node and improved the overall experience.
Several improvements have been made to Cardano’s layer-2 scalability solution. Developers have devised a mechanism to compute transaction costs as “min fee” and report them in the transaction cost benchmark.
New release for Hydra: 0.8.0!https://t.co/2U1P1qTaOT
— Sebastian Nagel (@ch1bo_) October 27, 2022
Took a bit longer than last time but it's packed with features:
- Persistence of Head state
- Improved contestation deadline reporting
- Fixed several bugs in the hydra-node
- Improved UX of the hydra-tui
- Static binaries
Cardano recovered from its steep decline on October 26
Ethereum’s competitor Cardano witnessed a steep decline on October 26 amidst market-wide drop in crypto and S&P 500. Over the past week, Cardano yielded 16% gains to holders and made a comeback above the $0.38 level.
Bob Mason, a leading crypto analyst has identified $0.41 as the next key level of resistance for Cardano price in its uptrend. The analyst believes that a breakout past $0.41 would signal a continuation of the bullish uptrend. Cardano would need the support of the broader market for continuation of its climb towards the $0.431 target.
Mason argues that in the event of an extended rally, Cardano price is likely to hit second major resistance at $0.431 and the third major resistance level at $0.464.
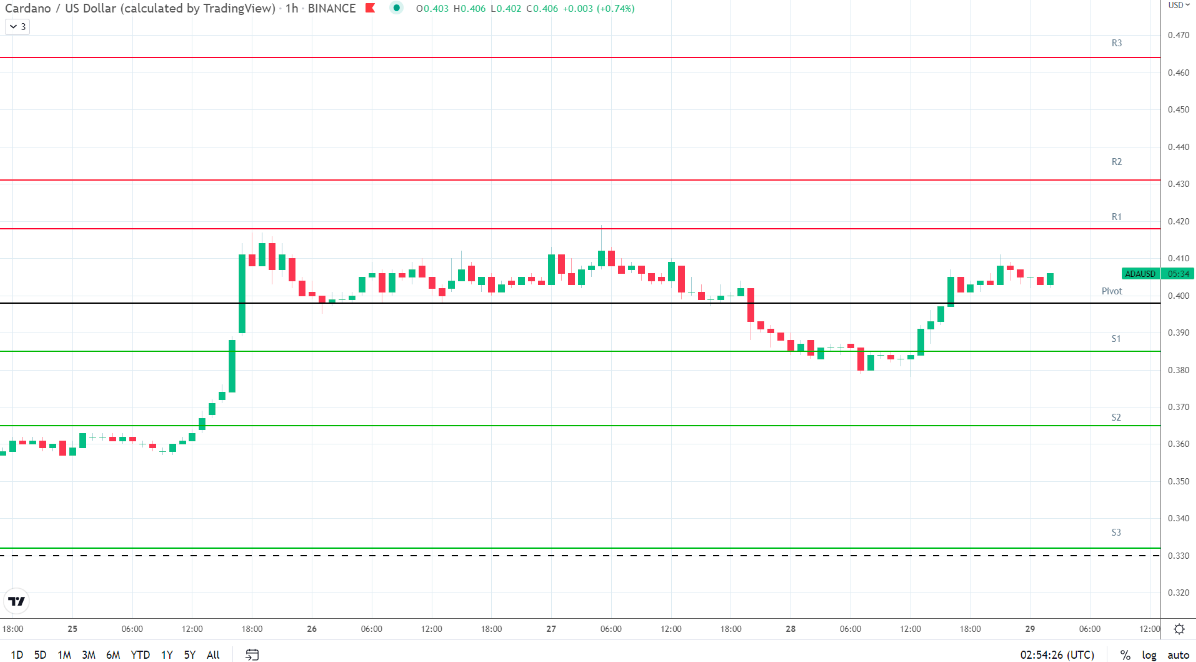
ADA/USD price chart
Mason believes that a bullish crossover of the 50-day EMA through the 100-day EMA would signal a move from resistance at $0.418 to the next major resistance at $0.431. However, a decline through the 200-day EMA at $0.398 could result in a trend reversal and a drop to the $0.385 level.
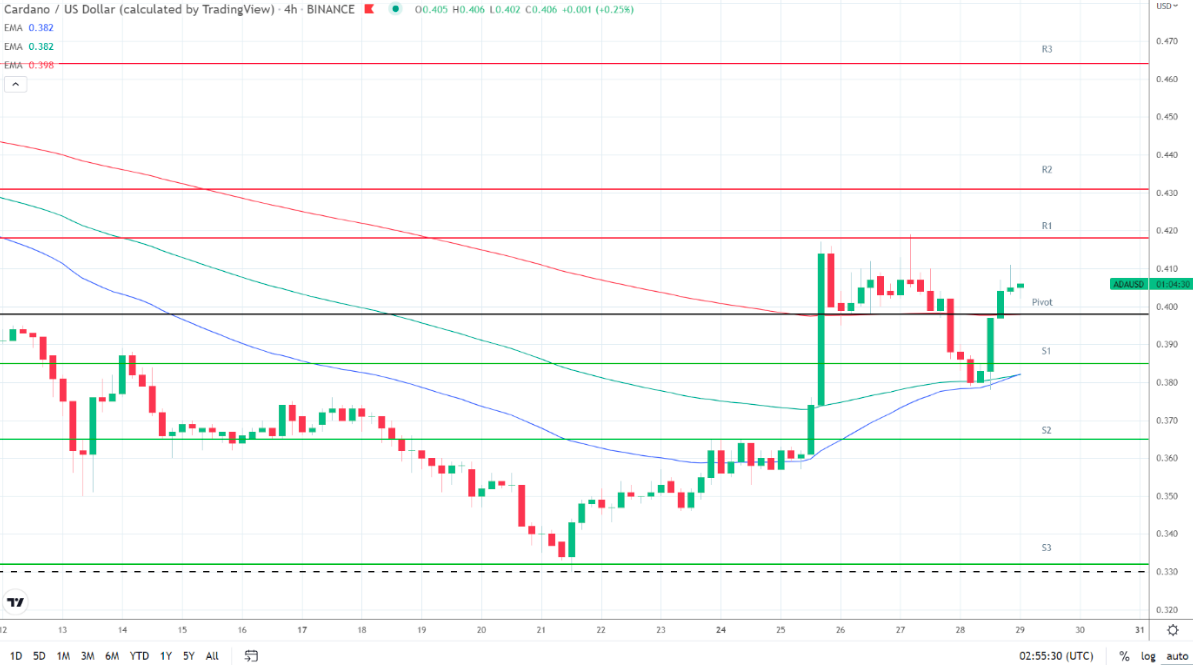
ADA/USD price chart with 50-day, 100-day, 200-day EMAs
Author

Ekta Mourya
FXStreet
Ekta Mourya has extensive experience in fundamental and on-chain analysis, particularly focused on impact of macroeconomics and central bank policies on cryptocurrencies.




