Cardano price impulsiveness recedes as ADA stalks $2.50
- Cardano price wedges higher after locating firm support at the 2018 high.
- 61.8% Fibonacci retracement of the ADA May correction now playing the role of resistance.
- Four-hour chart highlights a potential Golden Cross of two important moving averages.

Cardano price emerged from a descending channel on May 30 with a 9% four-hour candlestick, spiking ADA from below the 2018 high to the 61.8% retracement of the May correction. The advance has lacked impulsiveness, suggesting that the green token may need another pullback to engineer the price thrust required to lift the cryptocurrency to the all-time high.
Cardano price engaging bullish investors, but lack of emotion keeps gains limited
To review, Cardano price released from an inverse head-and-shoulders pattern on the four-hour chart on May 25. Still, it quickly faded under the dominant weakness in the cryptocurrency complex, thereby cutting below the right shoulder on May 29.
Following the failure of the inverse head-and-shoulders pattern breakout, the pullback designed a descending triangle, pulling Cardano price below the critical 2018 high at $1.39. ADA finally rallied through the channel’s upper trend line and above the 200 four-hour simple moving average (SMA) on May 30.
The 40% rebound from below the 2018 high to today’s high at $1.89 can be described as corrective, lacking the commitment and emotion that underpins impulsive rallies and suggests that Cardano price may need to refresh the recovery with a mild pullback, maybe to the key intra-day moving averages or lower.
The joining of the 50 four-hour SMA with the 200 four-hour SMA creates substantive support at $1.65-$1.67 and puts them on the path to register a Golden Cross on the four-hour chart. A Golden Cross occurs when the faster-moving average rises above the slower-moving average.
Suppose Cardano price takes on the personality of impulsiveness. In that case, ADA will need to overcome the 61.8% retracement at $1.90 to initiate the rally to the all-time high at $2.51, yielding a 38% return from the current price.
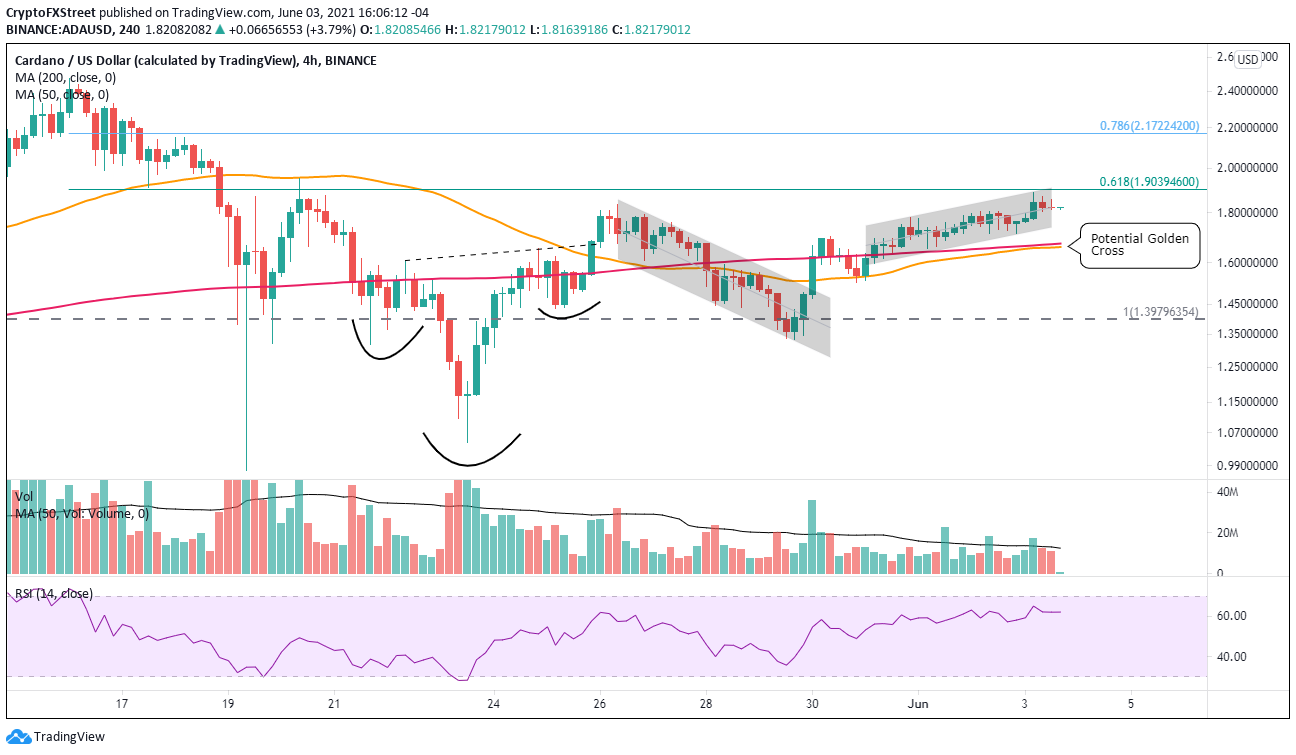
ADA/USD 4-hour chart
An ADA close below the 2018 high on a weekly basis may press Cardano price to revisit the May 24 low at $1.23. Additional weakness would frustrate the bullish narrative and suggest the digital asset is entering an alternative scenario that may include a test of the May 23 low.
ADA is a compelling story and only trades 38% below the all-time high at the time of writing, putting it in a comfortable position to lead the cryptocurrency market higher in the months ahead.
Author

Sheldon McIntyre, CMT
Independent Analyst
Sheldon has 24 years of investment experience holding various positions in companies based in the United States and Chile. His core competencies include BRIC and G-10 equity markets, swing and position trading and technical analysis.


