Cardano surges to over two-year high as on-chain metrics show bullish bias
- Cardano’s price surges more than 10% on Wednesday, reaching levels not seen since May 2022.
- On-chain metrics show bullish bias as trading volume reaches a 7-month high and whale transactions hit a 6-month high.
- The technical outlook suggests a continuation of the rally, targeting a significant psychological level of $1.00.

Cardano (ADA) price extends its bullish momentum, rallying more than 10% on Wednesday and reaching levels not seen since early May 2022. On-chain data further supports this rally as ADA’s whale transaction, trading volume, and open interest all rise, reaching record levels.
The technical outlook also suggests a continuation of the rally, setting the next target at the key psychological level of $1.00.
Cardano’s on-chain metrics look promising
Cardano’s on-chain metrics further support its price rise. According to Coinglass’s data, the futures’ Open Interest (OI) in ADA at exchanges rose from $585.37 million on Monday to $717.22 million on Wednesday, the new yearly high and highest level since November 10, 2021. An increasing OI represents new or additional money entering the market and new buying, which suggests a bullish trend.
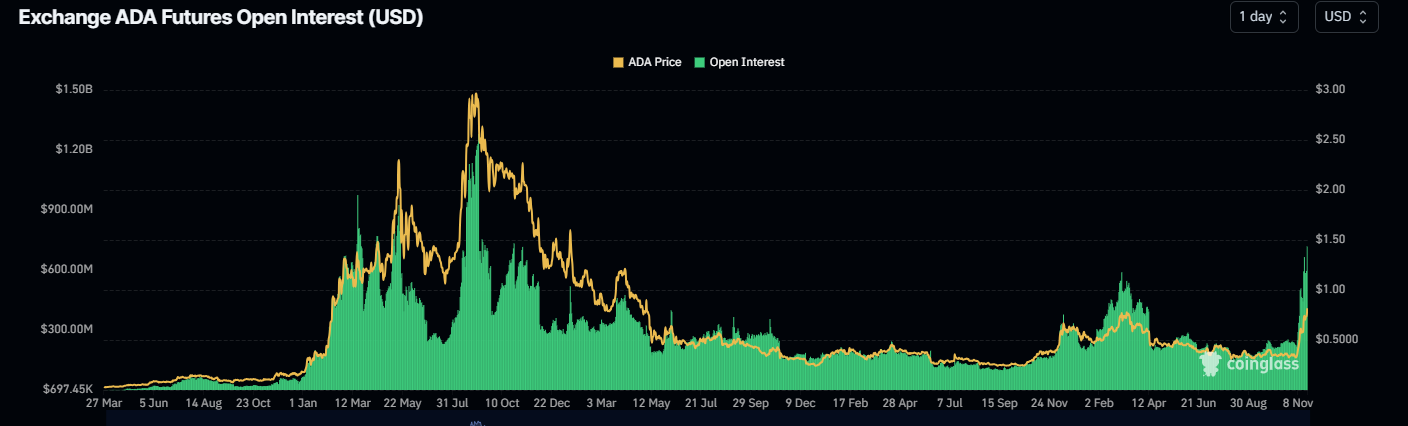
Cardano Open Interest chart. Source: Coinglass
Santiment’s data further adds credence to the bullish outlook. Cardano’s daily trading volume has risen to a 7-month high of $52.26 billion this week, and its whale transactions have reached a 6-month high, suggesting rising interest among ADA’s investors.
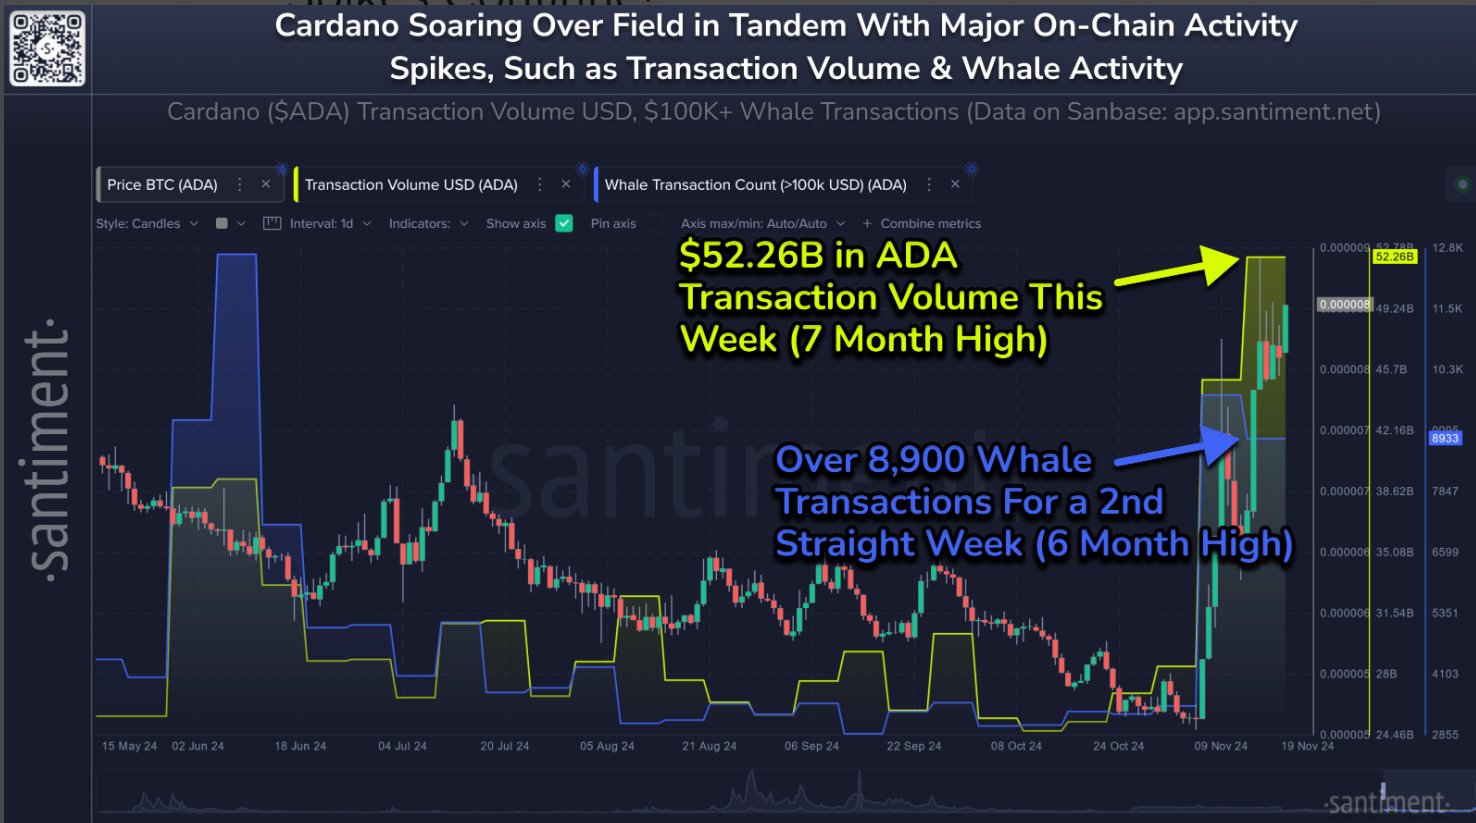
Cardano’s daily trading volume and whale transactions chart. Source: Santiment
Cardano Price Forecast: Eyes for $1.00 mark
Cardano price has rallied over 140% since the start of November, extending the bullish momentum and trading at $0.837 at the time of writing on Wednesday.
If ADA continues its upward momentum and closes above the 61.8% Fibonacci retracement level (drawn from an April 2022 high of $1.245 to a June 2023 low of $0.221) at $0.854, it would extend the rally to retest the significant psychological level of $1.00.
However, the Relative Strength Index (RSI) momentum indicator on the weekly chart stands at 77, hovering above the overbought level of 70, signaling an increasing risk of a correction. Traders should exercise caution when adding to their long positions, as the RSI’s move out of the overbought territory could provide a clear sign of a pullback.
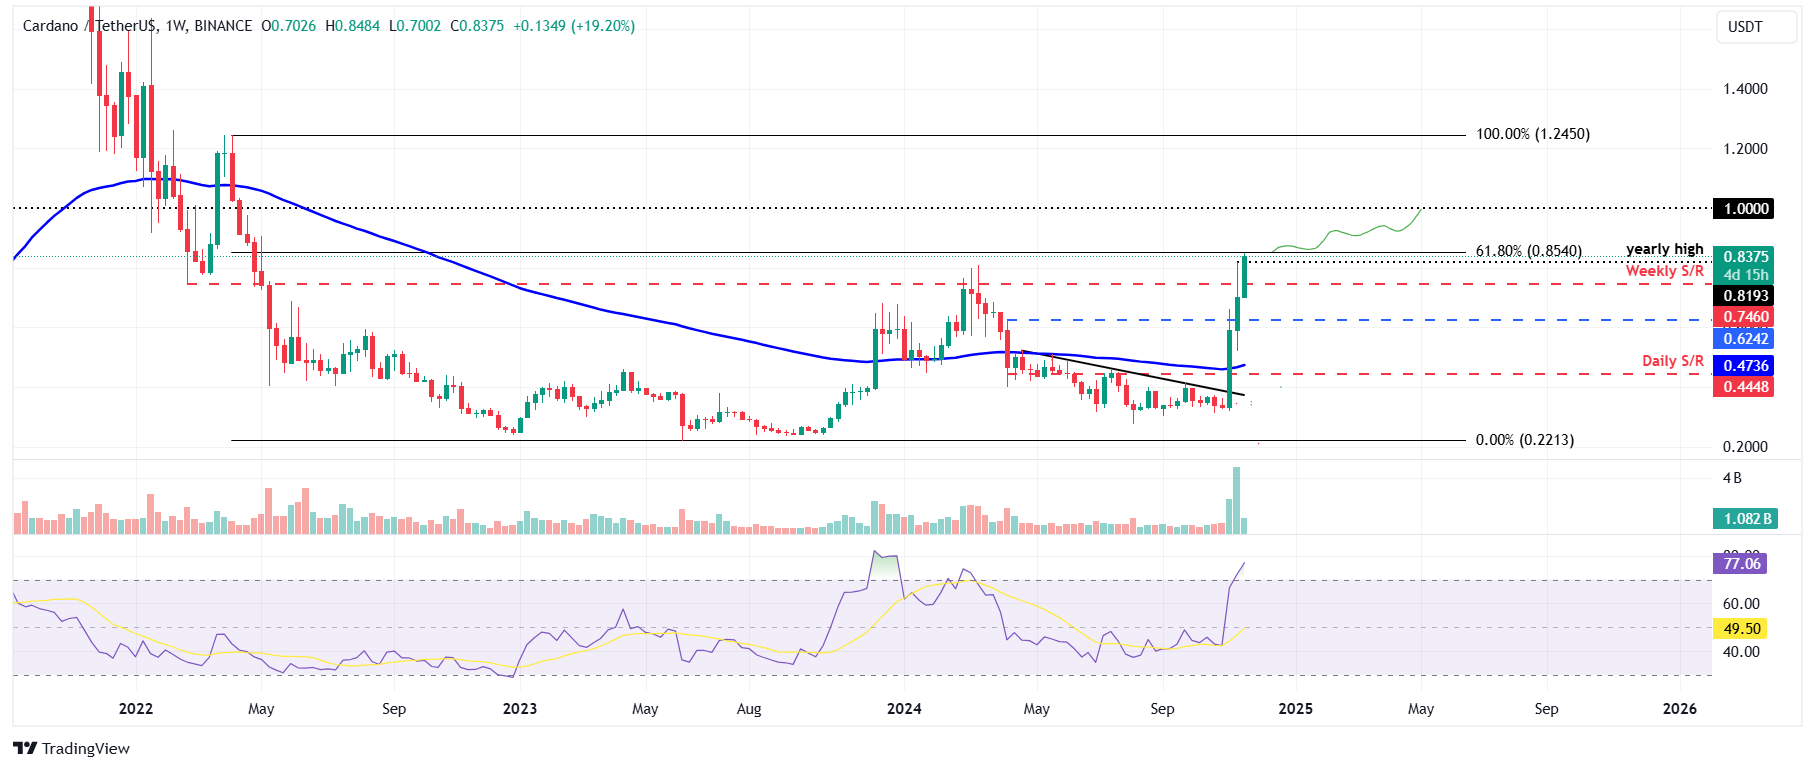
ADA/USDT weekly chart
Author

Manish Chhetri
FXStreet
Manish Chhetri is a crypto specialist with over four years of experience in the cryptocurrency industry.



