- Cardano price is at a make-or-break point as the critical level of support will determine the asset’s next moves.
- ADA could be headed lower with a 22% descent if the crucial line of defense fails to hold.
- Cardano could continue to be sealed in a downtrend unless the token slices above the upper boundary of the governing technical pattern.
Cardano price continues on in its prevailing downtrend as the buyers are nowhere to be found. ADA is nearing a critical support line which could determine the token’s next move as slipping below this level would put a bearish target at $0.80 on the radar.
Cardano bears eye 22% drop
Cardano price has formed a descending parallel channel on the 3-day chart, suggesting that ADA is sealed in a downtrend.
The last line of defense for Cardano price before additional bearish moves are anticipated is at the 200 three-day Simple Moving Average (SMA) at $1.03. Falling below this level would unravel a 22% descent toward the lower boundary of the governing technical pattern at $0.81, coinciding with the February 21 low in 2021.
Additional selling pressure may see Cardano price slice below the downside trend line of the prevailing chart pattern toward the 127.2% Fibonacci extension level at $0.71, intersecting with the February 6 low in 2021.
However, if a spike in buy orders occurs, Cardano price will face immediate resistance at the 78.6% Fibonacci retracement level at $1.07.
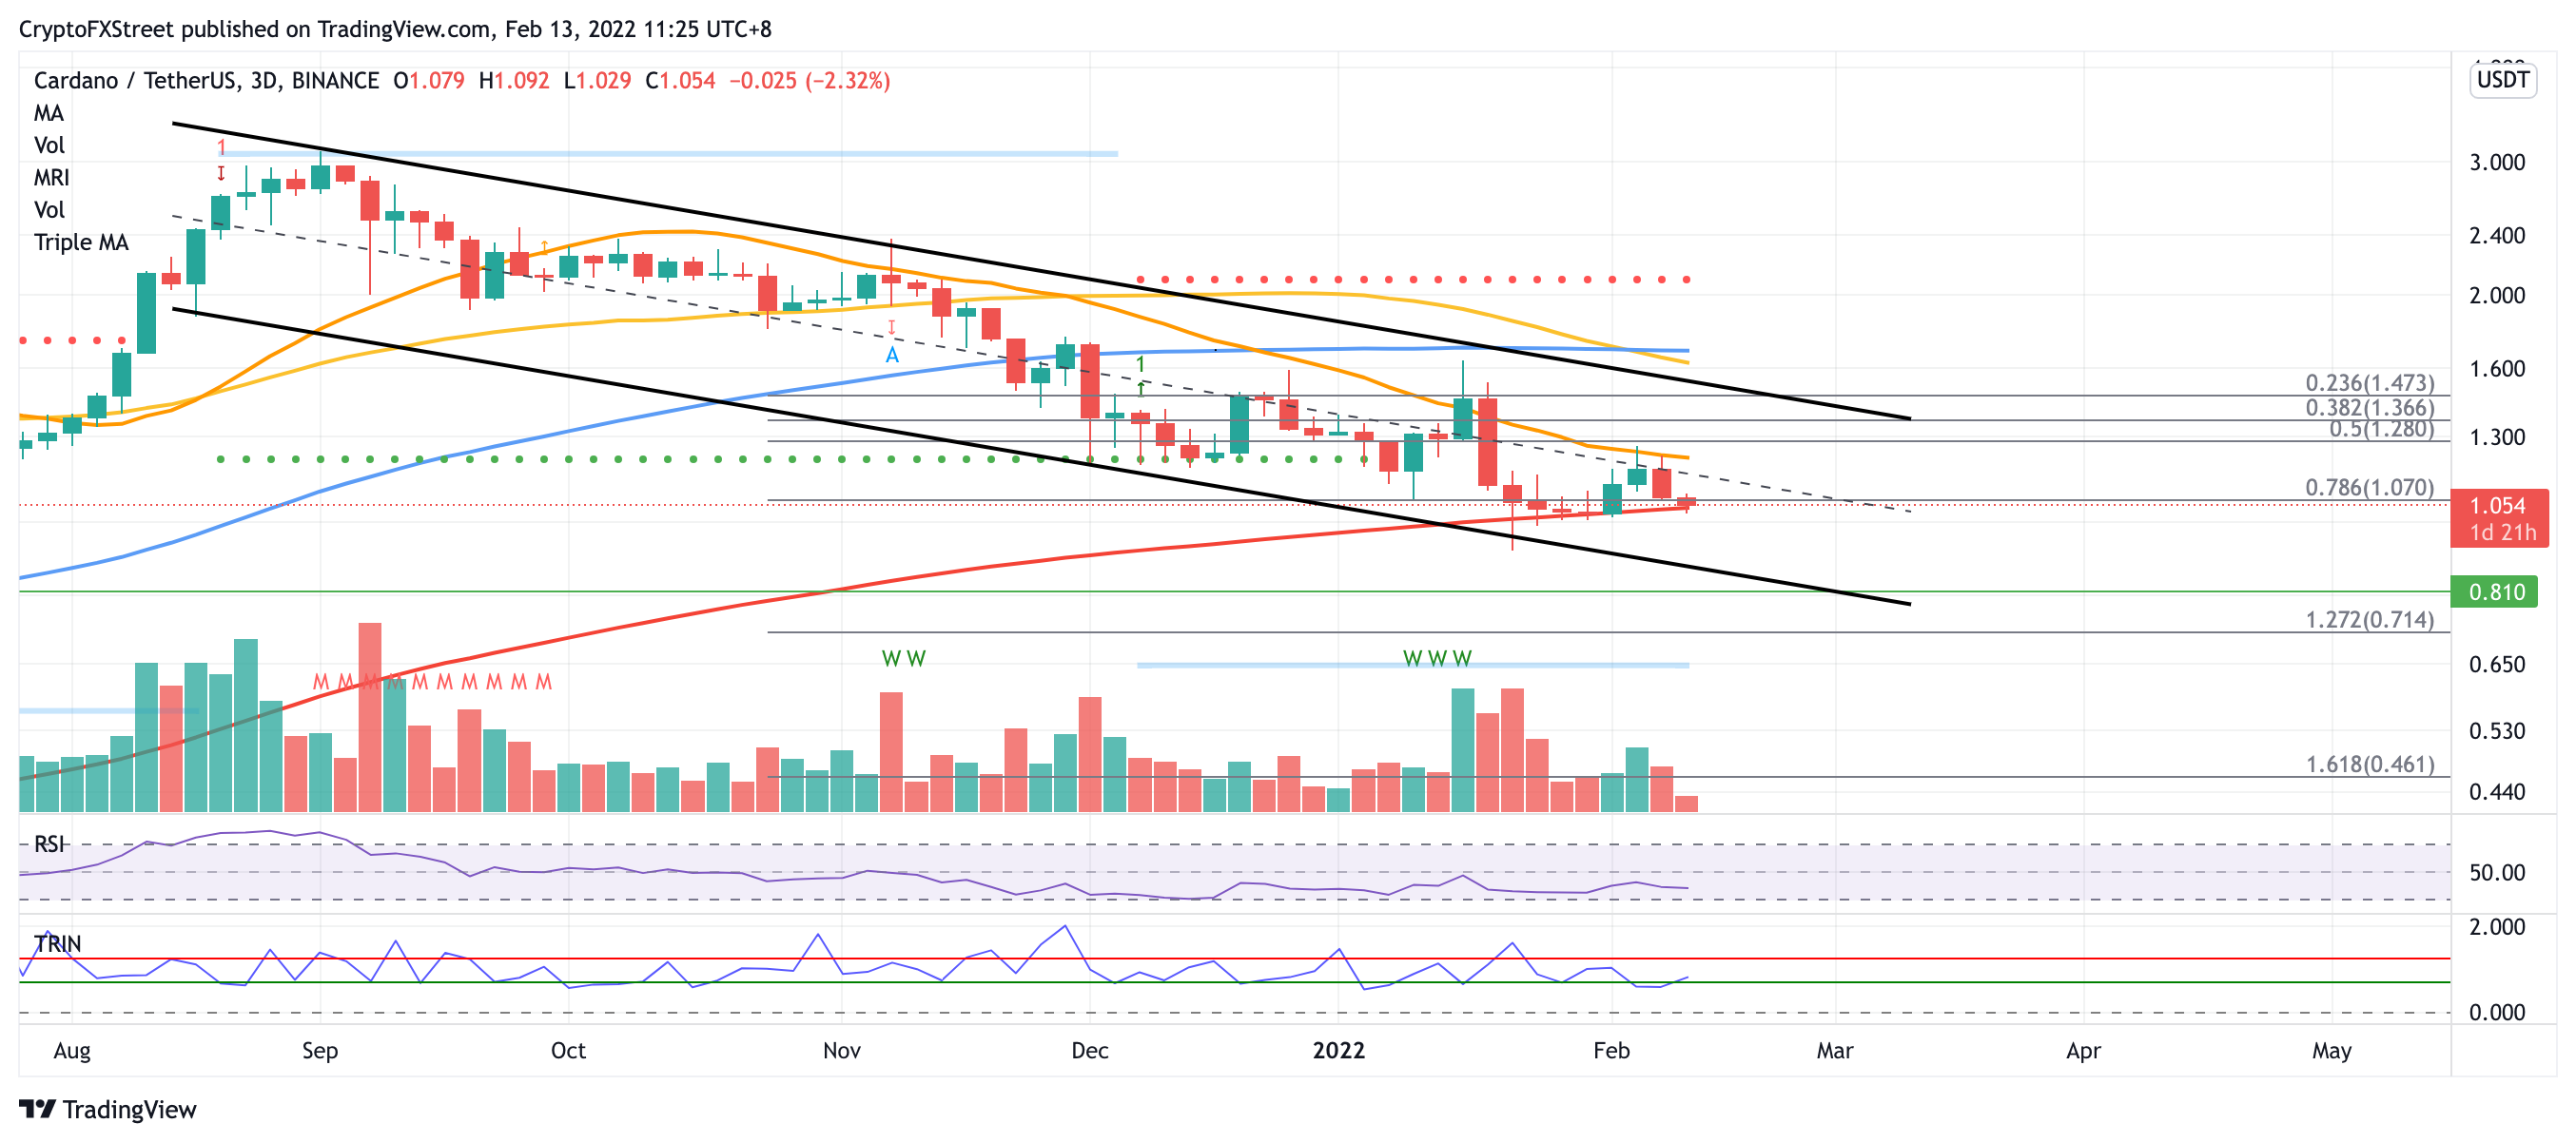
ADA/USDT 3-day chart
Additional obstacles may emerge at the middle boundary of the governing technical pattern at $1.14, then at the 21 three-day SMA at $1.22.
Cardano price must also break above the 50% retracement level at $1.28, the 38.2% Fibonacci retracement level at $1.36 and the 23.6% Fibonacci retracement level at $1.47, which coincides with the upper boundary of the descending parallel channel pattern in order to escape the downtrend.
However, even if Cardano slices above the topside trend line of the governing technical pattern, ADA will face further hurdles at the 50 three-day SMA at $1.61 and the 100 three-day SMA at $1.70 next.
Note: All information on this page is subject to change. The use of this website constitutes acceptance of our user agreement. Please read our privacy policy and legal disclaimer. Opinions expressed at FXstreet.com are those of the individual authors and do not necessarily represent the opinion of FXstreet.com or its management. Risk Disclosure: Trading foreign exchange on margin carries a high level of risk, and may not be suitable for all investors. The high degree of leverage can work against you as well as for you. Before deciding to invest in foreign exchange you should carefully consider your investment objectives, level of experience, and risk appetite. The possibility exists that you could sustain a loss of some or all of your initial investment and therefore you should not invest money that you cannot afford to lose. You should be aware of all the risks associated with foreign exchange trading, and seek advice from an independent financial advisor if you have any doubts.
Recommended Content
Editors’ Picks
Ripple's move above this key level could trigger nearly 50% rally for XRP
Ripple has overcome a critical resistance level and flipped into a support floor on the weekly time frame. This development happened while XRP tightly consolidated for roughly 250 days. Investors can expect XRP to kickstart a massive rally.
Optimism price outlook with nearly $90 million worth of OP tokens flooding markets on Friday
Optimism volatility has shrunk in the ours leading to the network’s cliff unlock. It joins the likes of dYdX and Sui, which have similar events on their calendars. As token unlocks are often considered bearish catalysts, investors should brace for a reaction after the event.
Top 3 Price Prediction Bitcoin, Ethereum, Ripple: Retail watches from the sidelines with a bias for shorts
Bitcoin could clear $73,777 peak as BTC bulls resurface. Ethereum might fall 10% before next leg up as ETH RSI teases with sell signal. XRP could lose $0.6000 threshold as Ripple bulls fail to show up.
Jito price could hit $6 as JTO coils up inside this bullish pattern
Jito price action shows a potential cup and handle formation. Based on theoretical measurement rules, a successful breakout could yield a 56% rally to $6.0. A breakdown of the $3.86 support level would create a lower low for JTO and invalidate the bullish thesis.
Bitcoin: BTC may have recovered, but is it out of the woods?
Bitcoin’s (BTC) upward momentum has shown a significant decline for the past two weeks or so. This development led to a bearish signal on the weekly and an uncertain outlook on the monthly.