Cardano price fails to secure momentum, as 2018 high haunts ADA
- Cardano price records a significant reversal at the 2018 high, reminding investors of February, March, and April struggles.
- 50-day simple moving average (SMA) becoming influential again, restricting upside price traction.
- ADA symmetrical triangle's upper trend line is a good source of support for any weakness.

Cardano price was firmly rejected at the 2018 high on July 26, emphasizing the importance of the level in securing a renewed and sustainable rally to the all-time high. Unless $1.40 can be broken on a daily closing basis, ADA is far from bullish outcomes.
Cardano price breakout carries no spirit, questioning the viability
On July 26, Cardano price resolved the long-standing symmetrical triangle with a daily close above the upper trend line. It was the culmination of the brief rally that began on July 21 after ADA fooled investors with a bear trap.
Since the breakout, Cardano price has struggled with the 50-day SMA, similar to the failed ADA attempts in mid-June that resulted in a new wave of selling, ending with the June 22 low at $0.98.
The measured move of the symmetrical triangle pattern is close to 63%, signaling a Cardano price target of $2.01, putting ADA less than 30% away from the all-time high of $2.51 printed on May 16.
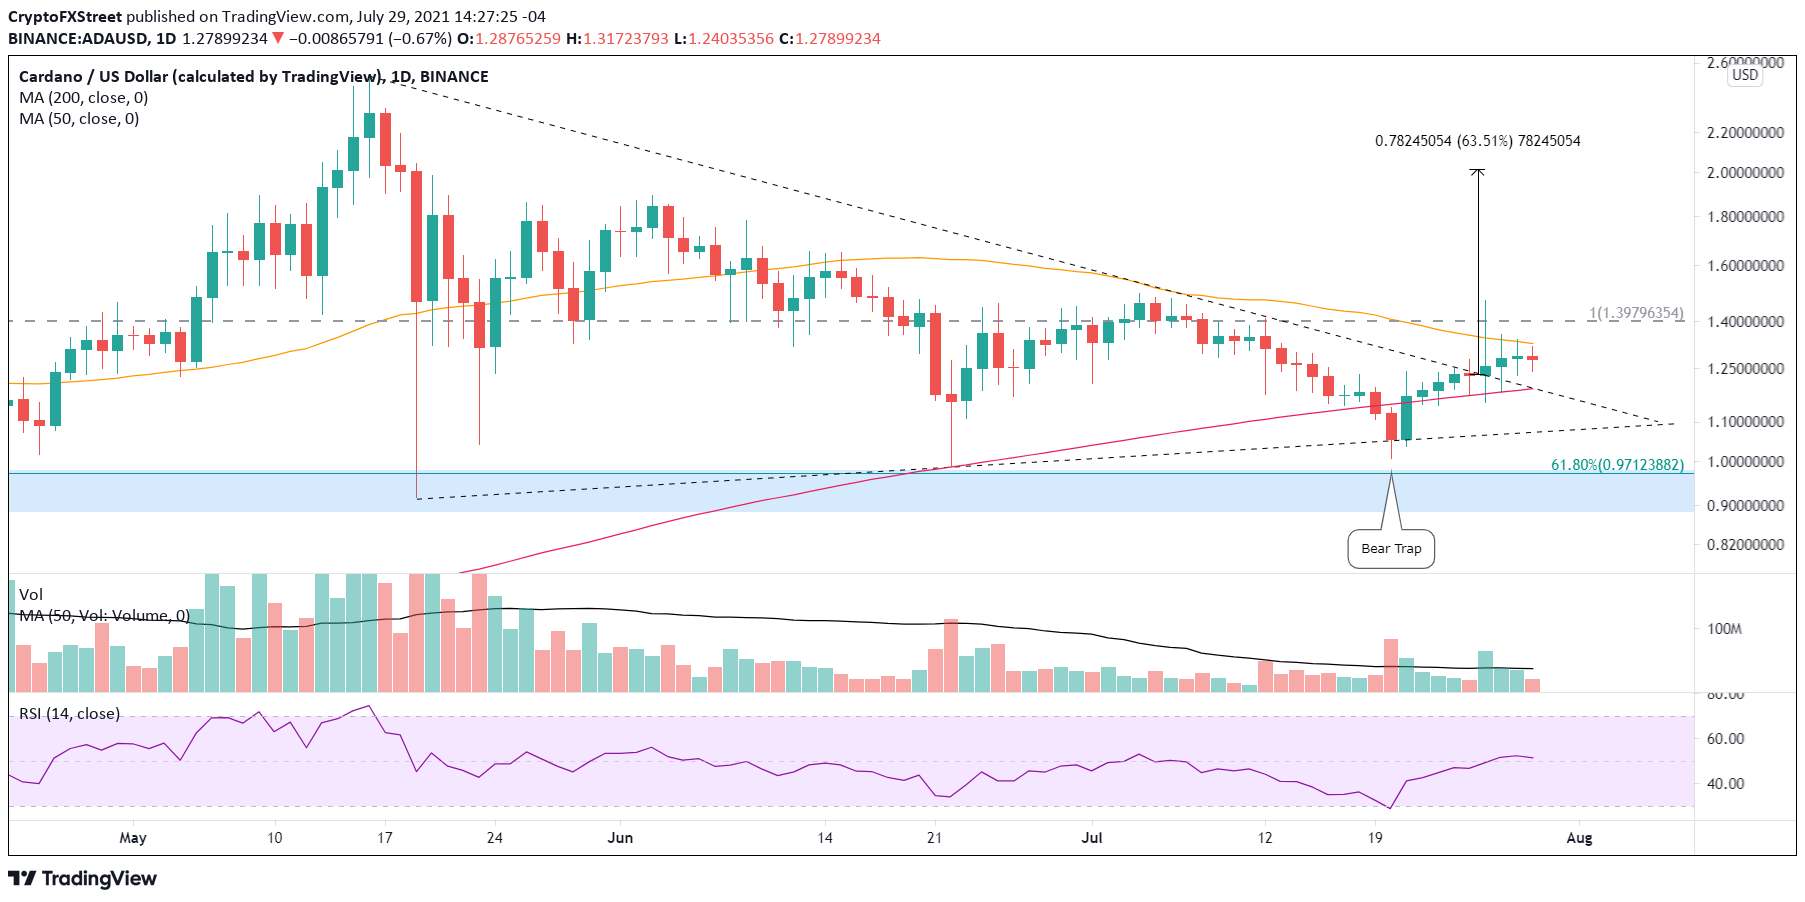
ADA/USD daily chart
From an intraday perspective, Cardano price could be shaping a cup-with-handle pattern that may provide the foundation for a sustainable advance and a successful test of the symmetrical triangle’s measured move target of $2.01.
The measured move of the cup-with-handle base is just over 37%, generating an ADA price target of $1.93, very close to the symmetrical triangle price target. Adding to the symmetry of the price structure is that the high of the handle is $1.40, further emphasizing how important the 2018 high is to bullish outcomes for Cardano price.
Thus, if Cardano price can sustain an advance above $1.40, ADA should be primed to target the range of $1.93-$2.01.
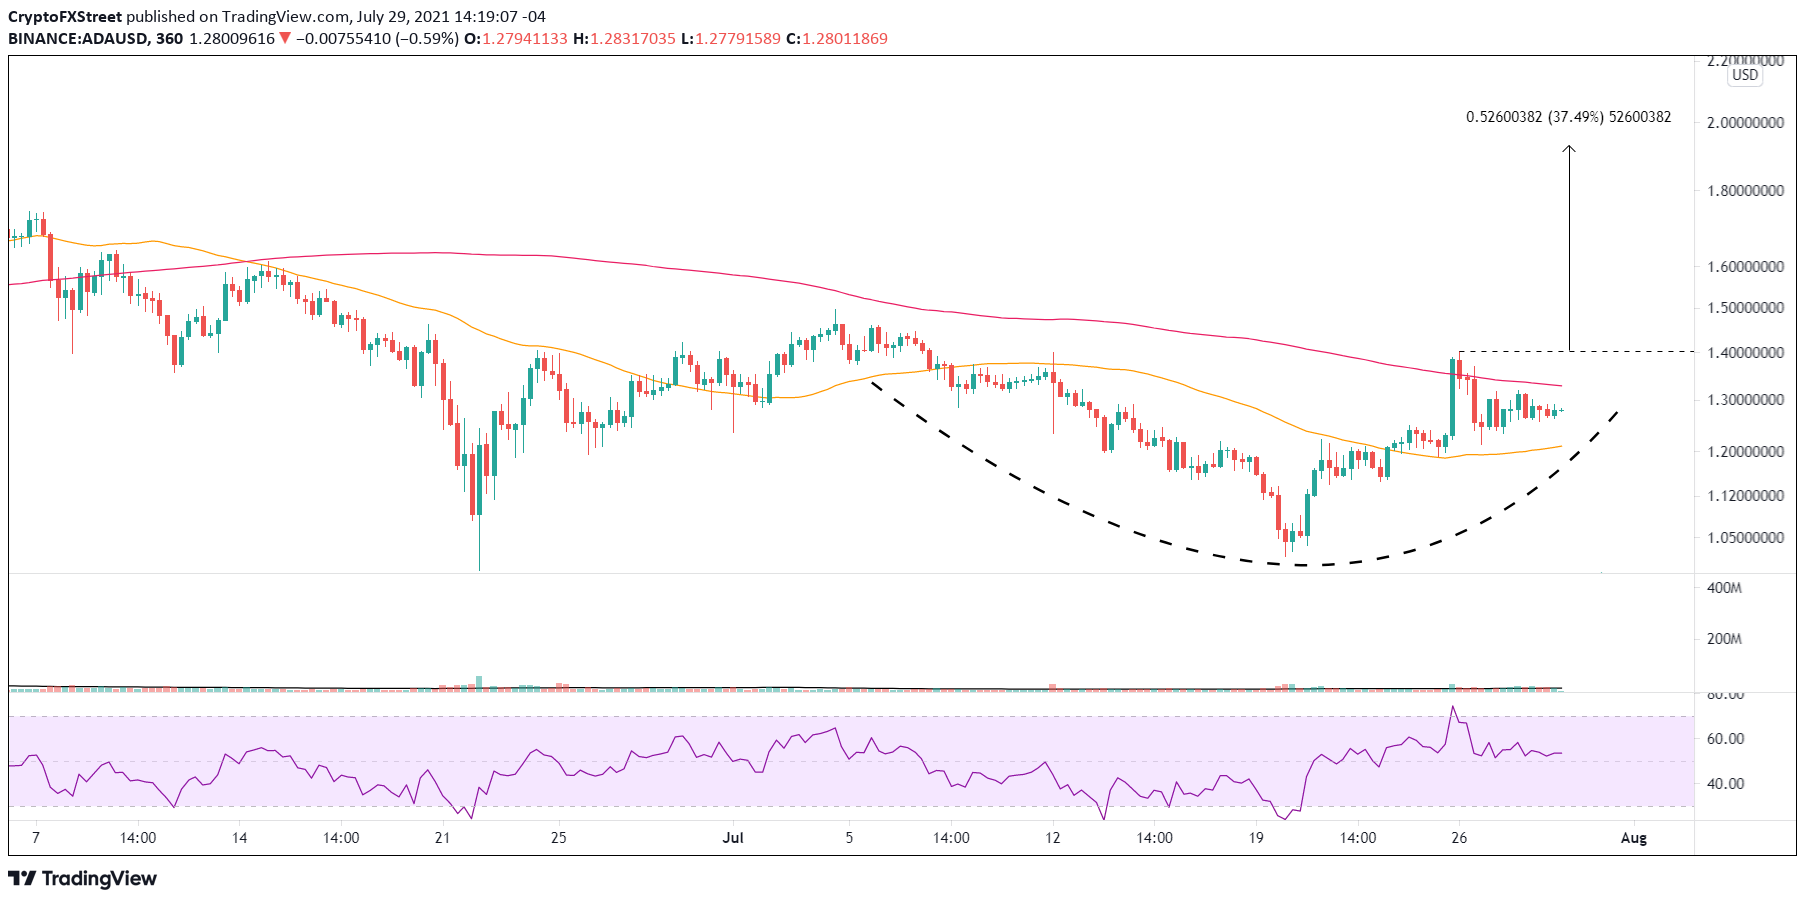
ADA/USD 6-hour chart
On the downside, Cardano price is supported by the confluence of the 200-day SMA at $1.19 with the symmetrical triangle’s upper trend line. Any weakness below the moving average will encourage a test of the triangle’s lower trend line at $1.07. If there is a collective sell-off in the cryptocurrency complex, ADA may reach the 61.8% retracement of the rally from March 2020 at $0.97.
Based on the price action over the 4-5 days, the Cardano price breakout from the symmetrical triangle does not look viable, but a close above $1.40 would change that statement, triggering the cup-with-handle pattern and swiftly pushing ADA to the $1.93-$2.01 range.
Here, FXStreet's analysts evaluate where ADA could be heading next as it seems bound to breakout.
Author

Sheldon McIntyre, CMT
Independent Analyst
Sheldon has 24 years of investment experience holding various positions in companies based in the United States and Chile. His core competencies include BRIC and G-10 equity markets, swing and position trading and technical analysis.


